This is Part 6 in a series of posts described here: https://kevinholman.com/2016/06/04/authoring-management-packs-the-fast-and-easy-way-using-visual-studio/
In our next example fragment – we will create a folder and views to see our monitoring data we have generated thus far.
Step 1: Download and extract the sample MP fragments. These are available here: https://github.com/thekevinholman/FragmentLibrary
I will update these often as I enhance and add new ones, so check back often for new versions.
Step 2: Open your newly created MP solution, and open Solution Explorer. This solution was created in Part 1, and the class was created in Part 2.
Step 3: Create a folder and add the fragment to it.
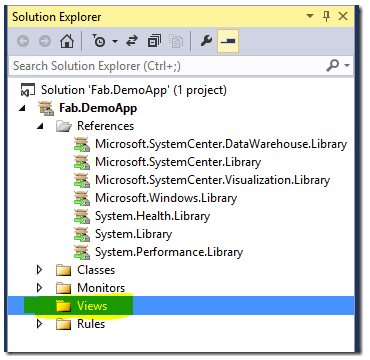
Create a folder called “Views” in your MP, if you don’t already have this folder.

Right click Views, and Add > Existing item.
Find the fragment named “Folder.State.Alert.Perf.Views.mpx” and add it.
Select Folder.State.Alert.Perf.Views.mpx in solution explorer to display the XML.
Step 4: Find and Replace
Replace ##CompanyID## with our company ID which is “Fab”
Replace ##AppName## with our App ID, which is “DemoApp”
Replace ##ClassID## with the custom class we created in Part 2 of the series. This was “Fab.DemoApp.Server.Class” from our previous class fragment.
That took all of 2 minutes. Take another few minutes to review the XML we have in this fragment. It is a simple set of view definitions for Alerts, Performance, and State, along with DisplayStrings for displaynames for each.
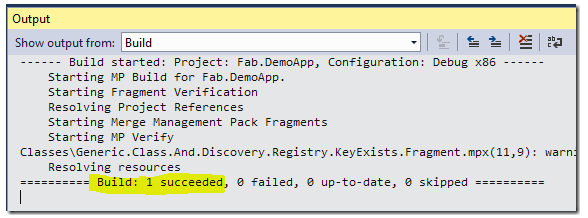
Step 5: Build the MP. BUILD > Build Solution.

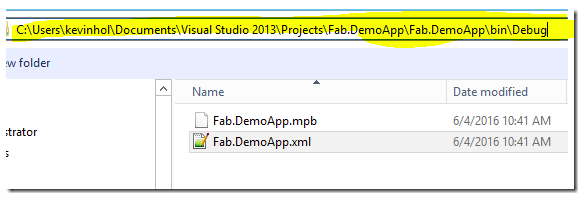
Step 6: Import or Deploy the management pack.

Step 7: Test the MP.
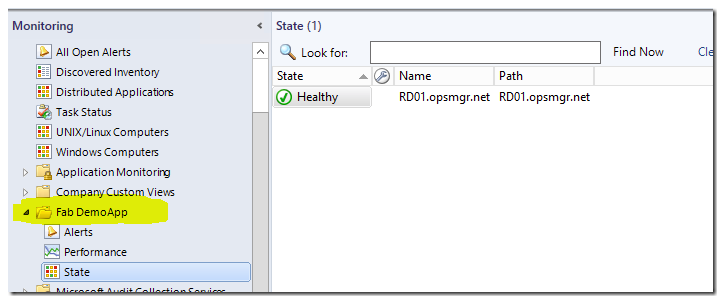
Open the Monitoring pane of the console – you will have a new folder and views:

From here you will see the alerts scoped to our custom app class, along with any performance and health state data for all discovered instances.

