This is Part 5 five in a series of posts described here: https://kevinholman.com/2016/06/04/authoring-management-packs-the-fast-and-easy-way-using-visual-studio/
In our next example fragment – we will create a rule to collect Windows Performance data.
Step 1: Download and extract the sample MP fragments. These are available here: https://github.com/thekevinholman/FragmentLibrary
I will update these often as I enhance and add new ones, so check back often for new versions.
Step 2: Open your newly created MP solution, and open Solution Explorer. This solution was created in Part 1, and the class was created in Part 2.
Step 3: Create a folder and add the fragment to it.
Create a folder called “Rules” in your MP, if you don’t already have this folder.
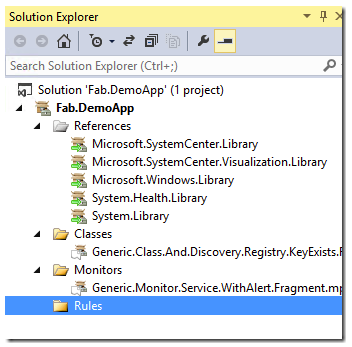
Right click Rules, and Add > Existing item.
Find the fragment named “Rule.Performance.Collection.Perfmon.mpx” and add it.
Select Rule.Performance.Collection.Perfmon.mpx in solution explorer to display the XML.
Step 4: Find and Replace
Replace ##CompanyID## with our company ID which is “Fab”
Replace ##AppName## with our App ID, which is “DemoApp”
Replace ##UniqueID## with something unique and descriptive for this rule, such as “TotalJobsPrinted”
Replace ##ClassID## with the custom class we created in Step 2. This was “Fab.DemoApp.Server.Class” from our previous class fragment.
Replace ##ObjectName## with a valid perfmon object. I will use “Print Queue”
Replace ##CounterName## with a valid perfmon counter. I will use “Total Jobs Printed”
Replace ##InstanceName## with a valid perfmon instance. I will use “_Total”
Replace ##FrequencySeconds## with a valid interval to collect the perf data. Generally either 300 seconds for more frequent collection, or 900 seconds for less frequent.
(Note: If your counter doesn’t have instances – you can just remove this in the XML so it looks like <InstanceName></InstanceName> )
That took all of 2 minutes. Take another few minutes to review the XML we have in this fragment. It is a simple rule definition, that collect windows performance counters.
Step 5: Save and Build the MP. BUILD > Build Solution.
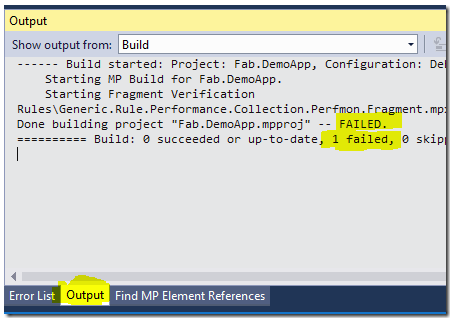
Uh Oh!
Error 80 Cannot resolve identifier Perf!System.Performance.OptimizedDataProvider in the context of management pack Fab.DemoApp. Unknown alias: Perf C:\Program Files (x86)\MSBuild\Microsoft\VSAC\Microsoft.SystemCenter.OperationsManager.targets 255 6 Fab.DemoApp
This is simple. We simply are calling on a module in our XML – but we haven’t added the MP that contains this module in our references. Lets do that now.
In Solution Explorer – add a reference by right clicking “References” and choose “Add Reference”
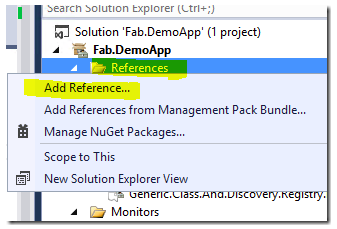
VSAE came with a bunch of common reference files – so browse to C:\Program Files (x86)\System Center Visual Studio Authoring Extensions\References. Pick the version of SCOM you want to be able to import this into, and select the “System.Performance.Library.mp”.
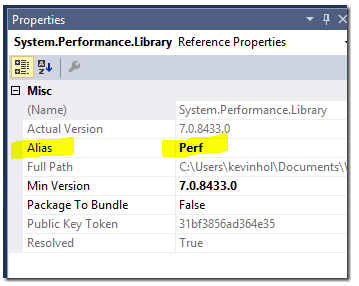
Highlight this MP in Solution Explorer under References, and in the properties window you will see the default Alias used, which you can change if necessary. I used the default VSAE reference aliases in all my fragments.
Ok, lets try again. Save All, then Build.
Grrrrrrrrr.
Error 80 Cannot resolve identifier MSDL!Microsoft.SystemCenter.DataWarehouse.PublishPerformanceData in the context of management pack Fab.DemoApp. Unknown alias: MSDL C:\Program Files (x86)\MSBuild\Microsoft\VSAC\Microsoft.SystemCenter.OperationsManager.targets 255 6 Fab.DemoApp
Same issue – because we need a reference for the data warehouse library in order to save performance data to the warehouse. So lets add another reference, for Microsoft.SystemCenter.DataWarehouse.Library.mp

Save All, then Build.
SUCCESS!!!!!!
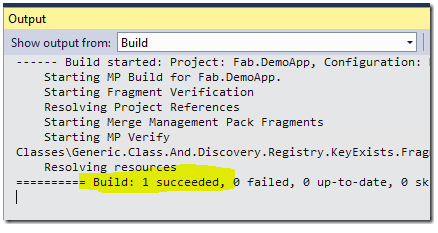
This was a little painful given how easy MP fragments are, because we got some errors. However, it is a good exercise in understand how Visual Studio tells us what is wrong, and some simple ways to go and fix them. Once we add references to our project, it will only need to be done once, so we wont have to go thought this again each time we add a performance rule. The hard part is over.
Take a break and get a coffee if you need to, but I recommend importing it first in the next step…. it takes a while after import before we can test our rule. ![]()
Step 6: Import or Deploy the management pack.

Step 7: Test the MP.
We need to wait for the agent to get the new MP version. You can watch for this in the agents OperationsManager event log.
We will see a 1200, 1201, then 1210 event sequence:

Once you get the 1210 – you can normally test the MP.
However, for performance collection, we need to wait about 10 minutes after the agent gets a copy of the MP and makes it active, because performance data takes a little longer to show up in the console.
After 10 minutes or so – find the instance of your class in Discovered Inventory, right click it, and choose Open > Performance View
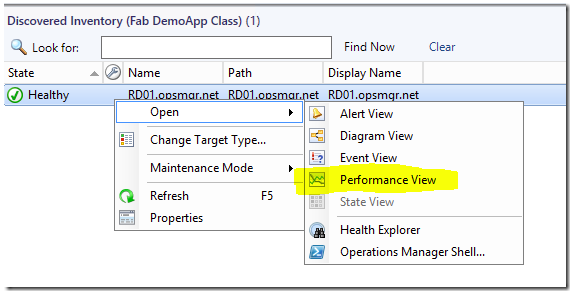
This will show all performance data associated with our custom class. Our default interval was every 5 minutes, so you need to wait considerable time before you will see lines in the chart. In order to test this one – you can actually print some notepad jobs to the “Microsoft XPS Document Writer” to change the counter values seen in perfmon.


hello kevin,
if i need to collect numbers of counters of a single proccess,what is the recommended way to do this according to this guide?
First – you need a proper target class, which represents computers that are guaranteed to have the process running. Next, use this fragment and collect whatever you want, and just reuse the fragment over and over. That’s a perfect use case for fragments.
Hi Kevin,
I used this process to try to add a performance collection rule to configure a monitor against for a queue we have on some of our systems. The class is there, the performance collection appears to work (I get data in the console), but no matter what monitors I’ve picked, no alerts will generate from it. I get a warning in the OM log on the local server that it can’t resolve the counter that I’ve created, and if I got to Performance Monitor, that information isn’t in there, which I suspect is why I can’t alert on it. Am I missing something here? If I’m collecting performance data, and that data is accurate, why would I not be able to monitor against it?
I feel like it’s a simple thing and I’m just missing it, but I have no idea.
Thanks much!
Scott
As another note, these fragments have been wonderfully helpful. This is the first time I’ve tried this particular task with them, though, so I’m not sure what I’m missing. Thank you for providing them and the instructions!