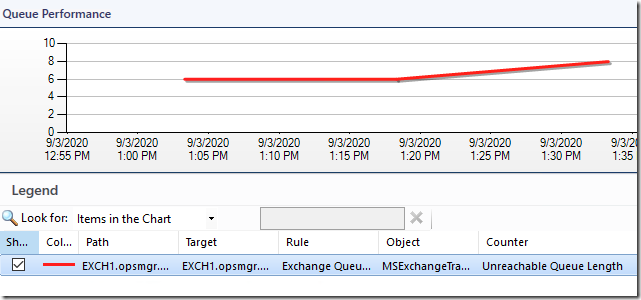
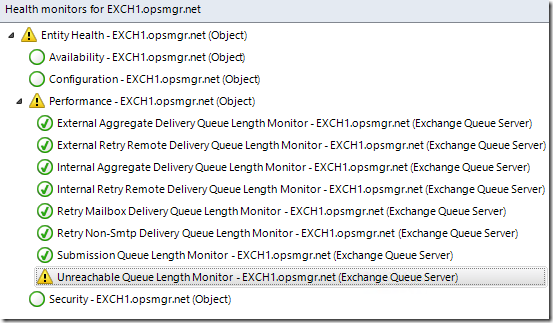
As customers move more and more to Office 365, the importance of monitoring Exchange Queues can potentially increase, to quickly detect connectivity issues between On-Prem and the Cloud. This article discusses a Management Pack add-on for Exchange 2013, 2016, and 2019 that will give you a visual dashboard of your Queues, monitor their health based on Queue Length.
Quick Download: https://github.com/thekevinholman/Exchange.Queues
This MP is a simplified version to focus only on Queues, based on the MP provided by Volkan Coskun here: https://docs.microsoft.com/en-us/archive/blogs/volkancoskun/exchange-2013-monitoring-mailbox-databases-and-queues
The MP will place a new folder in your Exchange MP root folder for queues:

There is a State view, a Performance View, and a quick Dashboard to show you all queues and their performance data:


Alerts will show up like any Exchange alert, in the default view:

It is important to note – that the DEFAULT Queue threshold values are set to “5000” items in the queue, and this MUST be customized for your environment. What’s normal or unhealthy for a Queue, varies wildly with each customer.

An important note – is to consider looking at the M365 Supplemental Management Pack, which creates synthetic transactions and goes far beyond Queue monitoring to detect issues:
https://monitoringguys.com/2021/01/13/m365-supplemental-management-pack-v1/
The M365 Supplemental Management Pack includes synthetic transactions that provide an increased level of visibility into the health of the Microsoft 365 environment. Making it the perfect companion to the M365 Admin Portal. The supplemental management pack provides a deeper view into the health of the on-premises and cloud environment. The management pack will execute synthetic transactions from a local point-of-presence (Watcher Node) within the customer network for a comprehensive view of service availability.
- Mail flow – Validate mail flow by sending a test email from a sender mailbox and validating receipt in the receiver mailbox.
- Licensing – Verification that a single dedicated user can obtain a license, Monitoring the available pool of licenses for a given subscription.
- Performance – Collection of performance rules including Watcher Node connection to Office 365, Mail Flow send/receive and Document upload/download.
- SharePoint Online – Validate the ability to upload and download files to specific SharePoint Online sites.
- OneDrive – Upload/Download Synthetic Transactions
- Microsoft Teams – Synthetic transactions providing state of the messaging channel

Extraordinary feedback, im thanking with your info.
Kevin,
there is your servername hardcoded in XML line 142. Probably you’d like to replace it with $ExchServerName.
Thanks for the MP, great work.
Best,
Patrick
Yikes!!!! You are right – just fixed. Thanks!!!
That was what I’d call a “quick fix” 🙂
yw, thanks back
Hi Kevin,
Just wondering if you could assist with a question relating to the Exchange 2013 MP.
We’re currently getting a “not monitored” state for all Exchange IIS Application Pools.
All monitors, rules and discoveries appear to be enabled in the pack by default.
There are other components being monitored successfully e.g. Exchange Windows services.
Do you have any suggestions regarding how to have application pool state reported in the console?
Environment is Exchange 2016, with APM disabled on agents.
Thanks,
Christian.
That’s by design. There are no monitors targeting that class, therefore it shows “Not Monitored”. Those app pools are monitored by the IIS MP.
Thanks Kevin.
This is really great, Thank you Kevin. Finally we can monitor the queues in our fleet including the EDGE servers in DMZ. Awesome.
Getting this error on the Queues Dashboard:
Please provide the following information to the support engineer if you have to contact Microsoft Help and Support :
Microsoft.EnterpriseManagement.Presentation.DataAccess.DataProviderException: An error occurred executing the command: [Microsoft.SystemCenter.Visualization.Component.Library.DataProviders!PowershellProvider/ExecutePowershellDataSourceScript] in provider: [Microsoft.SystemCenter.Visualization.Component.Library.DataProviders.PowershellProvider, Microsoft.SystemCenter.Visualization.Component.Library.DataProviders, Version=7.0.5000.0, Culture=neutral, PublicKeyToken=31bf3856ad364e35].This module uses the dot-source operator while exporting functions using wildcard characters, and this is disallowed when the system is under application verification enforcement. —> System.Management.Automation.CmdletInvocationException: This module uses the dot-source operator while exporting functions using wildcard characters, and this is disallowed when the system is under application verification enforcement. —> System.Management.Automation.PSSecurityException: This module uses the dot-source operator while exporting functions using wildcard characters, and this is disallowed when the system is under application verification enforcement.
at System.Management.Automation.MshCommandRuntime.ThrowTerminatingError(ErrorRecord errorRecord)
— End of inner exception stack trace —
at Microsoft.EnterpriseManagement.Monitoring.DataProviders.RetryCommandExecutionStrategy.Invoke(IDataProviderCommandMethodInvoker invoker)
at Microsoft.EnterpriseManagement.Presentation.DataAccess.DataProviderCommandMethod.Invoke(CoreDataGateway gateWay, DataCommand command)
— End of inner exception stack trace —
at Microsoft.EnterpriseManagement.Presentation.DataAccess.DataProviderCommandMethod.Invoke(CoreDataGateway gateWay, DataCommand command)
at Microsoft.EnterpriseManagement.Presentation.DataAccess.CoreDataGateway.ExecuteScalarInternal[TResult](DataCommand command)
at Microsoft.EnterpriseManagement.Presentation.DataAccess.CoreDataGateway.b__2[TResult](f__AnonymousType0`1 data)
Any ideas?
Hi Kevin,
Getting error that below dependent MP are missing while trying to import this MP.
Name Version
Microsoft.Exchange.15 15.0.669.22
Looks like I don’t have the latest exch MP
How to install .MP file ?
Thank you for the Exchange Queue MP.
How to display the Dashboard Queue in the Web Console?
Hey Kevin,
I see in the XML where the threshhold and severity are set, but I can’t seem to find these to override in the console. I apologize if this is a dumb question, but I am fairly new to SCOM and can’t find any accurate documentation for this.
This monitoring was added to the latest Exchange MP – so MY MP should no longer be necessary. Which one are you using?
I believe the MPs that are in use are this one a Microsoft Exchange Server 2013 Monitoring. Is there a better one to be using? This environment was setup prior to me working on it.
Disregard, I finally found the settings. If anybody else finds this and is confused like me, the path is below
Authoring > Management Pack Objects > Monitors > search for “Exchange Queue Server” > Entity Health > Performance.
The different monitors are listed in there.
Is there a way to monitor copy queue as well?
Is there management pack that supports Exchange SE? Upgraded to latest one I could find (15.0.669.23), but it would not discover it.