This article covers SQL Agent job monitoring in the current SQL Version Agnostic Management pack, version 7.0.20.0 and later.
I will cover three conceptual areas:
- Out of the box experience and defaults
- SQL Agent only monitoring (monitoring all jobs at the agent level)
- SQL Agent Job monitoring (optionally discovering and monitoring agent jobs on an individual level)
Out of the box, we don’t discover or monitor individual SQL agent jobs by default. What we do is discover the SQL Agent object:

Out of the box, we monitor for Service Running status, Last Job Run Status, and Job Duration:

Last Run Status – checks all jobs on the SQL Agent every 10 minutes, and if ANY job didn’t complete successfully this monitor will stay in a warning state. This does not generate an alert because there is an override to disable alerts to control noise. If you want this level of monitoring, you need to override Alerting back to enabled.
Job Duration – checks all jobs on the SQL Agent every 10 minutes, and if ANY job takes longer than 60 minutes it will set a warning state, or 120 minutes for a critical state. Alerting is also disabled via override. If you want this level of monitoring, you need to override Alerting back to enabled.
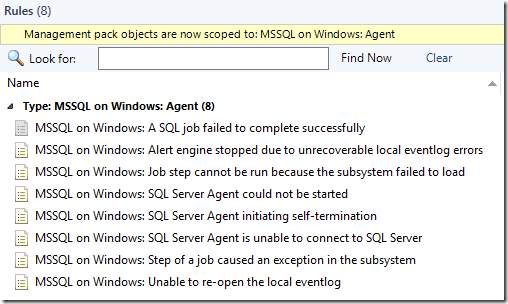
There are also several rules that target the “SQL Agent” object, that primarily look in the Application event log for issues/errors related to the SQL Agent:

Notice that the “A SQL job failed to complete successfully” is disabled out of the box. This was done to reduce out of the box noise…. as many customers have terribly monitored/maintained SQL environments and have so many jobs failing that this was almost un-actionable. If you want to be alerted to ANY SQL Agent job failure of any kind – then you might consider enabling this rule via override. I would recommend this if you aren’t going to discover and monitor individual SQL agent jobs (covered later in this article).
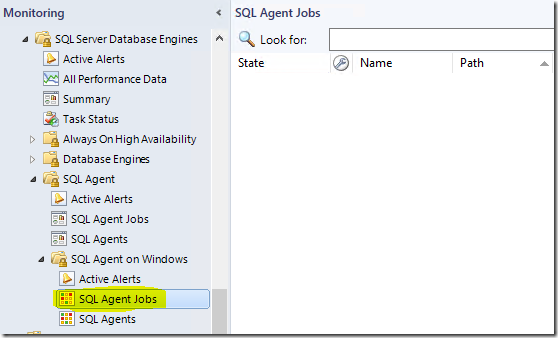
Ok – that covers the out of the box defaults, and SQL Agent level monitoring. Now, what if I need to go deeper, and have the ability to override settings for individual SQL Agent jobs? You will notice that in the view for SQL Agent Job State – there are no objects:

This is by design, because we don’t discover SQL Agent jobs individually out of the box. This is because customers have potentially tens of thousands of individual SQL Agent jobs, and discovering these is optional because it can increase load on the monitored agent, and increase instance space and monitoring load in SCOM.
That said, there are scenarios where you might wish to enable this. Perhaps you have SQL Agent jobs that you don’t want to monitor at all, or others that have especially long run-times that need unique thresholds (like SQL backups or maintenance on VERY large DB’s) In this case – we will want to enable the discovery to discover SQL Agent jobs as discovered objects in SCOM.
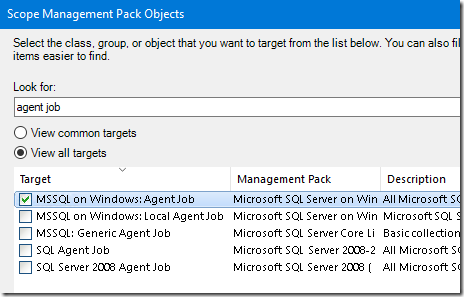
To enable the object discovery, go to Authoring Pane, select Object Discoveries. In the upper right corner, select Change Scope, then View All, Clear All. Search for “Agent Job”, and select “MSSQL on Windows:Agent Job”

This will show you the discovery we are looking for: “MSSQL on Windows: Discover SQL Server Agent Jobs”

Notice this is disabled by default. Create an override, “For all objects of class: MSSQL on Windows: Agent” and set Enabled = True. Save these overrides to your custom “Overrides – SQL” management pack.

This discovery runs every 4 hours by default, so within 4 hours you should see your SQL Agent job state view populated with your individual SQL Agent jobs. However, you will likely see agent jobs showing up within a few minutes after making the change, if it was never enabled before. (**Hint – to speed this process up in a lab scenario, bounce the Microsoft Monitoring Agent service on your agents – as this will force a discovery to run on service startup)

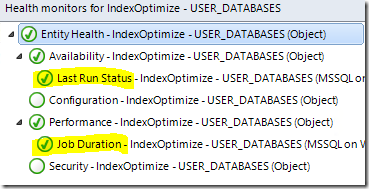
Now – lets talk about what we monitor by default for discovered SQL Agent jobs. There are a total of two monitors. Last Run Status, and Job Duration:

Last Run Status – monitor checks every 10 minutes, and will remain Yellow (Warning state) for any job whose last run was not a success. This gives you a nice “real time” view of the unhealthy jobs that need some attention.
Job Duration – monitor runs every 10 minutes, and looks for jobs that have exceeded a run-time threshold. The default is 60 minutes (warning) and 120 minutes (critical).
Note*** – On BOTH of the above monitors, alerting is disabled by default to control noise. The out of the box configuration is to show state only. You must override each monitor if you want alerts.
In the following example – I am creating an override for my SQL agent job that performs Index Operations, setting the thresholds higher and enabling alerting….. and saving it to my “Overrides – SQL” management pack:

As you can see, this gives you SQL Agent job by job granularity.
You could easily also create groups of SQL agent jobs based on group name…. if you wanted to treat all jobs with the same or similar names the same from an override perspective. This will additionally ease the burden of maintaining overrides using a dynamic group based on criteria of the job:

See my other SQL MP How-To posts:
https://kevinholman.com/2019/06/12/how-to-transition-to-the-sql-version-agnostic-mp/
https://kevinholman.com/2016/08/25/sql-mp-run-as-accounts-no-longer-required/
https://kevinholman.com/2020/01/31/how-to-exclude-sql-express-edition-from-scom-monitoring/

Thx for this Article! As usual very detailed and informative.
Hi Kevin,
Regarding “Job Duration” monitor, Is there any way to append the actual job duration of the job on the alert description?
That would not be possible, because most of the time, the job is still running. This monitor triggers when any individual job is running over the threshold. It doesn’t wait until the job complete, so it cannot give you an actual duration.
Hello Kevin,
We have the SQL MP version 7.015.0 in our environment. Recently we had a request from 1 of our client asking to monitor their SQL agent jobs. This particular SQL box is a 2019 one. Is there any option to monitor the SQL agent job of a SQL 2019 agent with the existing MP. I did override the object discovery MSSQL on Windows: Discover SQL Server Agent Jobs” for this specific object which failed too. Would like to know other possibilities apart from installing the Agnostic pack.
7.0.15.0 is the SQL Version Agnostic MP.
However, the first version to support SQL 2019 is 7.0.20.0 and this is documented in the MP Guide. You need to keep your MP’s up to date to monitor the latest versions of anything.
Hi Kevin,
We would like to monitor the failed job status using monitor and generate alert. Last run status doesn’t generate critical alerts in SCOM active alerts. Can you please guide .
I would like to avoid using rule as rule as rule can trigger alerts for each run if job runs too frequently and fails.
Hello,
I would like to have an solution for the health state. Only Warning is available either if you take an override for the critical state.
I need the monitor state for critical rollup.
I’ve been trying to implement this on our platform, but we’re on SCOM 2012 SP1 and the “SQL Agent on Windows” views won’t import due to a datawarehouse.report.library (7.1.10266.0) dependency missing. Is this supported fully on 2012 SP1?
Hi Kevin,
thanks for sharing this!
Our SCOM databases (including the Reports database) are part of a SQL Server Always On Availability Group, and now I get a bunch of alerts from Report Server jobs that fail to run on the secondary database, because it is read-only.
Any suggestion how to fix this, apart from overriding the error on the SCOM database servers, or writing a SQL Server Agent Job that periodically checks the current database role, activating jobs when the role is “primary” and disabling them when the role is “secondary”?
I have not run into that. I’ll have to play with that when I have some time.
Hi Kevin,
I have enabled Discovery of SQL Agent Jobs in Agnostic management pack 7.0.34.0. Still Agent Jobs are in Not monitor state . How to fix this issue in SCOM 2012 R2
Thanks
There are two monitors targeting SQL agent job – and they should initialize and roll up health state to the SQL agent job object. If this is not happening, you’d need to look at the event logs on a SQL server. You likely have a rights issue in your security configuration or something is failing at a module level.
Hi Kevin, I faced the problem with “Last Run Status” – monitor for agent jobs. I Discovered all jobs for all SQL servers without a problem, instances for them was created and they are visible in “agent jobs view”. I noticed that for couple of jobs this monitoring not working – I see that job failed on SQL Server but monitor in SCOM stay healthy. There are any special circumstances for individual job that monitor change their state ?
Hi Kevin,
is there a possibility to change the warning into an Error?
Hi Kevin,
I have enabled SQL agent only monitoring.
Few agents are discovering MSSQL on windows agent job and they are healthy. Few agents are not discovering MSSQL on windows agent Job and nothing is displaying under MSSQL on windows agent job column.
Please assist here.
Hi Kevin,
We’ve noticed that agent jobs that are configured in contained availability groups are not discovered, which offcourse is due to the fact that the SQL agent of that contained availability group is not discovered.
Have you found any workaround for this or perhaps have any insight if this is a feature that still needs to be added to the official MP?
Hi Kevin,
Job duration triggered an alert when the threshold was breached. The monitor is in unhealthy state also. After some time, the job for which the alert was triggered is not running now. But the monitor continues to be in unhealthy state. How is the workflow for the monitor to change its state to healthy.
Hi,
Do these alert monitors roll up the health status to the top of the distributed application, changing the health status of the entire tree?