This is based on 6.6.4.0 version of the SQL MP
First – understand the SQL MP discovers the following items:
- SQL Database
- SQL DB File Group
- SQL DB File
- SQL DB Log File
The Database > hosts > DB File Group > hosts DB File.
Also – the Database > hosts > DB Log File.
Let’s start with free space monitoring in the DB file, this is the lowest level of monitoring.
There are unit monitors that directly target the “SQL Server 2012 DB File” class.
The monitor for space is called: “DB File Space” (Microsoft.SQLServer.2012.Monitoring.DBFileSpaceMonitor)
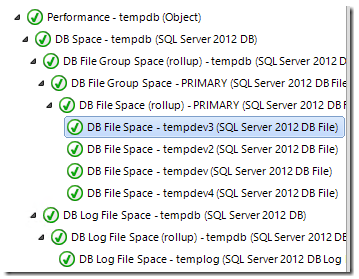
This runs every 15 minutes, and accepts a default threshold of 10% (critical) and 20% (warning). This monitor does not generate alerts – it simply rolls up state. The reason for this is because you can have multiple files in a file group for a DB, and just having a single file being full is not an issue.
Microsoft.SQLServer.2012.Monitoring.DBFileSpaceMonitor uses the Microsoft.SQLServer.2012.DBFileSizeMonitorType
Microsoft.SQLServer.2012.DBFileSizeMonitorType uses the Microsoft.SQLServer.2012.DBFileSizeRawPerfProvider datasource.
Microsoft.SQLServer.2012.DBFileSizeRawPerfProvider datasource runs GetSQL2012DBFilesFreeSpace.vbs with the following parameters from the Monitor configuration:
“$Config/ConnectionString$” “$Config/ServerName$” “$Config/SqlInstanceName$” “$Target/Host/Host/Host/Property[Type=”SQL!Microsoft.SQLServer.DBEngine”]/TcpPort$”
This script checks many configuration settings about the individual DB file – then rolls up a health state after complete.
Scenario: Autogrow is enabled
- If autogrow is enabled for the DB file, the script checks the DB setting for FileMaxSize to be set.
- If FileMaxSize is set – this is considered the upper limit to threshold against. (unless logical disk size is smaller than FileMaxSize)
- If FileMaxSize is NOT set (Unlimited) then the logical disk size is considered the upper limit.
Scenario: Autogrow is NOT enabled:
- If autogrow is not enabled, then the file size is considered the max file size and this value is used for threshold comparison.
The DB files will be healthy or unhealthy based on this calculation. Again – no alerts yet.
Next – all the discovered DB file monitors roll their health state up one level to the monitor “DB File Space (rollup)”

This is a rollup dependency monitor targeting the filegroup object, and has a “best state” rollup policy. Which means if ANY child DB file has free space, then the rollup is healthy. That makes sense.
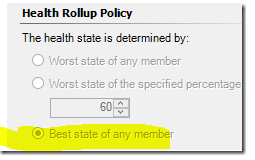
This monitor DOES generate alerts named “File Group is Running out of space”

This monitor rolls up health to “DB File Group Space” monitor.
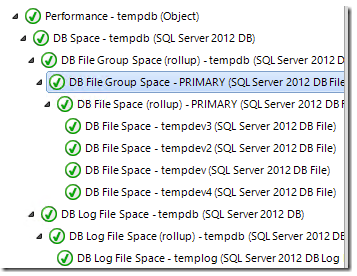
which is an Aggregate monitor, which has a “Worst state of any member” policy. This is used for rollup only.
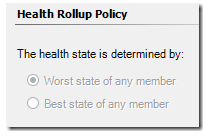
This monitor rolls up health to the “DB File Group Space (rollup)” monitor
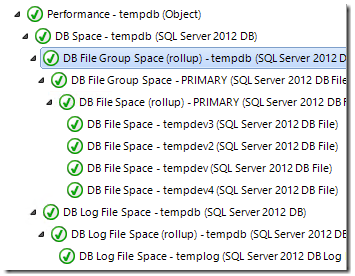
This is a rollup dependency monitor targeting the database object, and has a “worst state” rollup policy. Which means if ANY FILE GROUP is unhealthy, we consider the DB unhealthy.
This rolls up to the “DB Space” monitor, which is an Aggregate rollup monitor to roll health to the DB object.

SUMMARY of DB file monitoring:
- The ACTUAL space monitoring in the SQL MP is done at the individual DB file level.
- Alerting is done at the DB File GROUP level based on a “best of” rollup.
- Everything else is designed to roll the health up correctly from DB file to File Group, and from File Group to Database object.
Log file free space monitoring:
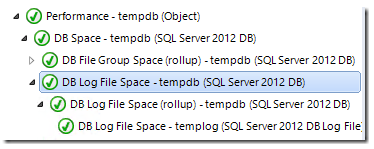
This works EXACTLY like DB file space monitoring, except it is less complicated because there is no concept of a “filegroup” so the log file monitor rolls up to the DB object with a single dependency monitor (rollup), which is also where the alerts generate from.
Now, if you DO use autogrow, and you place multiple DB files or log files on the SAME logical disk – the management pack does NOT take that into account, so your individual DB and log file monitors might not trigger because they individually are not above the threshold, but cumulatively they could fill the disk. This is why the Base OS disk free space monitoring is still critical for SQL volumes. This is documented in the MP guide.
Alternatives:
IF – for some reason – a customer did not want to discover DB files and file groups, and ONLY wanted the total database space calculated, there is a disabled monitor targeting the DB object for the DB and one for the log file. You could optionally disable the discovery of DB files and filegroups, and have a MUCH simpler design (although not quite as actionable potentially)

A customer might take this approach if they have a VERY large SQL environment, and wants to reduce scale impact by not discovering DB file groups and DB files. Additionally, this reduces all the performance collection impact which would otherwise be collecting data for all those individual objects.
Another reason to take this approach is if you have a HUGE SQL server with a LOT of databases and DB files. The amount of scripts running on that server could be VERY large and very impactful to the server. You could selectively disable the discoveries for that server, run the Remove-SCOMDisabledClassInstance to clean them out of SCOM, and then enable just the smaller monitors.
If you don’t NEED monitoring of individual files and file groups, this approach makes some sense.

Amazing article, thank you!
One quick question, the generated alert for the file group doesn’t say how much is the value that is breaching the threshold and our DBAs would like the alert to have that on the description, is there any way to add that to the description? It’s greyed out and I’m not able to change it…
Thanks !
My SQL 2012 DB File Space unit monitor constantly goes from Not Monitored (empty green circle) to healthy (seems at every check) and is generating high number of state changes. Is this normal?
Not at all.
How many Databases and DB files are in that instance? This sounds like either the healthservice is restarting, or you are over the recommended 50DB and 150 DB file limits.
Hi Kevin,
Thanks for demystifying this for everybody!
For some reason our SCOM 2012 R2 environment Filegroup running out of space calc is not seeing the max autogrow size.
I have a DB that uses 775.34GB and the space reserved is 869.14GB and the max file size is 1TB with autogrow enabled. I have not overrode the default alert thresholds. With autgrow taken into account, the filegroup is not 80% or greater used but I still get the “Filegroup is running out of space” alert.
Any ideas on what could be the issue and/or where to look?
Thank you!
We are running SCOM 2012 R2 and we have been frequently noticing the alert “Operations Manager failed to start a process” generating from a couple of Servers.
Alert Descriptions:
———————————————————————————-
Forced to terminate the following process started at 9:51:16 AM because it ran past the configured timeout 300 seconds.
Command executed: “C:\Windows\system32\cscript.exe” /nologo “GetSQL2016DBFileGroupFreeSpace.vbs” “servername\sqlinstancename” “FQDN” “sqlinstancename” “1114” “1048576” “0”
Working Directory: C:\Program Files\Microsoft Monitoring Agent\Agent\Health Service State\Monitoring Host Temporary Files 750\740\
One or more workflows were affected by this.
Workflow name: many
Instance name: many
Instance ID: many
Management group: Management group name
———————————————————————————-
Forced to terminate the following process started at 8:08:09 PM because it ran past the configured timeout 300 seconds.
Command executed: “C:\Windows\system32\cscript.exe” /nologo “GetSQL2016DBFilesFreeSpace.vbs” “servername\sqlinstancename” “FQDN” “sqlinstancename” “” “1048576”
Working Directory: C:\Program Files\Microsoft Monitoring Agent\Agent\Health Service State\Monitoring Host Temporary Files 4313\1717\
One or more workflows were affected by this.
Workflow name: many
Instance name: many
Instance ID: many
Management group: Management group name
———————————————————————————————–
First, that is from a very old management pack. You should update to the latest MP’s before troubleshooting.
Second, the most common cause of this for timeouts is too many databases. The SQL MP supports up to 150 databases on a server. How many does this instance have?
We are running SQL Server MP version 7.0.15.0. Most of the servers which generated this alert have more than 200 Databases running on each of them. We tried to exclude the unwanted Databases from being discovered at first. But the SQL Database Discovery does not allow to use a Group with all the unwanted databases and to be overridden nand disabled (this just does not work, which is strange). Instead it gives only the option to Exclude the Databases using the Exclude List Override Parameter. But when we have more than 200 databases on each Server and over time the unwnated Databases discovered will only increase and we cannot Exclude these number of Databases using the Exclude Parameter. We have overriden and disabled the SQL Database monitors usning a Dyanmic Group with all unwanted Databases in it. But I guess this is not a proper solution. Do we have any solution for this.
Hi Kevin,
We are planning to disable the DB File Group Space and Log file free space monitoring. And to Enable the simple Monitors DB Total Space and Transaction Log Free Space (%). We noticed that Transaction Log Free Space (%) is available for SQL Server 2012 and later versions. But for SQL Server 2008 this monitor does not exist, however there is a Monitor [Deprecated] DB Log File Space Free (%) which is deprecated. I guess this is the same monitor as Transaction Log Free Space (%) running on SQL Server 2012 and later versions, could you please confirm?
Since this monitor ([Deprecated] DB Log File Space Free (%)) is deprecated, is it possible to enable this monitor and will it work after enabling.
Thanks in advance!