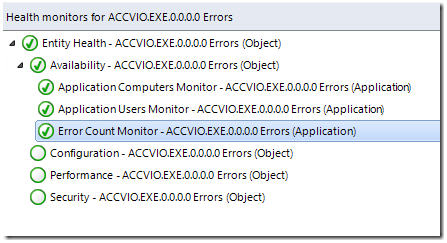
If you use SCOM’s Agentless Exception Monitoring, to examine application crash data and report on it…. one of the artifacts of SCOM is that this data never grooms out of the SCOM Operational Database.

One of the things you can do is to disable all of the monitors that ship with AEM that are enabled out of the box – if you don’t use them:

And you can look through all the rules present in the Client Monitoring Internal Library, and disable any of these that do nothing but “set state” on monitors. These do so by running queries to SQL on a regular basis.
What is worse, is that every AEM crash dump from a client, will create a Windows Computer object in SCOM, and over time these can add up in the tens of thousands or more. Soon, the SCOM environment will be overloaded with all of these instances and relationships of the applications, error groups, and Windows Computers, all of which are hosted by the management servers.
I was working with a customer and we had a very hard time keeping config working, slow console access, etc. The majority of the data we need for AEM is in the data warehouse, most of the stuff left over in the OpsDB is really not all that useful. Here is a process to clean it out periodically.
In the SCOM console – Administration – Management Servers view – disable Client Monitoring wherever you have it enabled. Make sure you capture all your settings first on how you have it configured.
Once Client Monitoring is disabled – open an OperationsManager PowerShell session on a management server, and run Remove-SCOMDisabledClassInstance

In my case – this ran VERY quickly, but in the case of a very large environment, this could take a long time to complete, and might even require several runs.
This operations does not delete the old AEM data from the database – but it does mark it as deleted. You can see this from this SQL query:
select Fullname, Name, DisplayName, IsDeleted
from BaseManagedEntity
where fullname like ‘%AEM%’

Normally it takes 2-3 days to groom out old “deleted” data – but we can speed this up in SCOM by running the following query:
DECLARE
@TimeGenerated DATETIME,
@BatchSize INT,
@RowCount INT
SET @TimeGenerated = GETUTCDATE()
SET @BatchSize = 10000
EXEC p_DiscoveryDataPurgingByRelationship @TimeGenerated, @BatchSize, @RowCount
EXEC p_DiscoveryDataPurgingByTypedManagedEntity @TimeGenerated, @BatchSize, @RowCount
EXEC p_DiscoveryDataPurgingByBaseManagedEntity @TimeGenerated, @BatchSize, @RowCount
Now – the above statement will only groom out 10000 deleted items. It is possible you might have a lot and this will require several runs. You can get an idea of the amount of data to delete by running this:
select count(*)
from BaseManagedEntity
where IsDeleted = 1
So – when we run the grooming script above – it will remove the data from the database. Make sure you have plenty of space for your TempDB and transaction log, as this might use quite a bit of log space when running the Remove-SCOMDisabledClassInstance or when grooming the data.
Once complete – you can see in the console all the historical Windows Computers, Applications, and Error Groups are gone, and you can re-enable Client Monitoring for a fresh start. This will not affect the data in the DW for reporting.
