There are several really good blogs out there which document some of the struggles and workarounds with getting SNMP TRAP monitoring to work. I’ll reference some of them at the bottom, but this will be mine to document what worked, what didn’t, and some MP authoring examples that don’t exist anywhere else on the web.
In order for SCOM 2012 to accept traps from network devices, there is a laundry list of configuration prerequisites. Lets just jump in.
First clarification (and update to this blog post) – There is NO NEED to install or configure the SNMP service on the management server. We don’t use the SNMP stack. In fact – if the SNMP TRAP service is running (it does not by default) then only thing I need to do is make sure it is disabled!
There are LOTS of blogs out there saying the SNMP service is required, and quite frankly – it isn’t…. the SCOM SNMP trap listener uses a MonitoringHost.exe process and does not interact with the Windows SNMP stack. I initially posted about configuring this because ALL of the blog resources pointed to the need for the SNMP service, but in my testing this is totally not required. Thanks to Mihai for setting me straight again. ![]()
Open Services. The only thing we need to make sure is that the SNMP Trap service should be disabled. There were lots of incorrect postings about the trap service early on. Notice – the SNMP service is not even installed here:

Next, I create a network monitoring resource pool in SCOM. I want to lock down which management server I will use to receive traps, and to lock this to a single management server for any troubleshooting.

I’ll assign a single MS to this pool for the purposes of trap reception:

Next – in order to accept traps from any network device – that device MUST be discovered and use SNMP as an access mode. See: http://blogs.technet.com/b/kevinholman/archive/2011/07/21/opsmgr-2012-discovering-a-network-device.aspx
In this example, I will discover a Linux System running Ubuntu, because that is easy to generate SNMP traps. Remember – SCOM 2012 filters out any SNMP traps and will not discover a Windows Computer as a SNMP device, therefore using a Windows Computer and trapgen is not suitable for testing.
Here is a good walkthrough on setting up the Ubuntu Server: http://www.it-slav.net/blogs/2009/02/05/install-and-configure-snmp-on-ubuntu/
Once you install and config SNMPD on Ubuntu, you can send test traps from Ubuntu to the SCOM 2012 server from the command line. First – we need to discover the Ubuntu server:
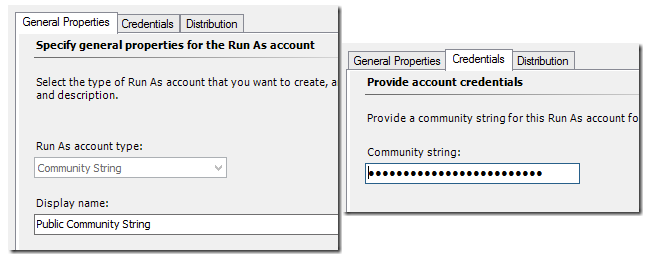
Under SCOM Administration, Run As accounts, create a new account, of type Community String. I will be using “public” for mine but you can use anything configured for your network, as long as you used this on the Ubuntu server. Remember, this is a password, and it is case sensitive.
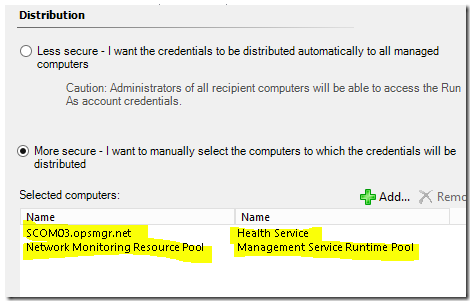
Distribute the account to your Management server and/or resource pool for network monitoring.
Next, create a discovery for the Ubuntu server:
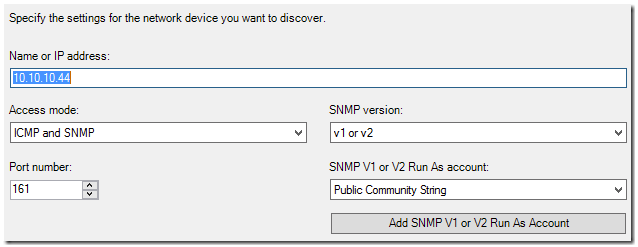
Make sure this device discovers correctly:

Next up – we need a “catch all” rule in SCOM to collect all received traps, and collect them as events. This will be helpful for troubleshooting. If you are going to receive a large number of traps, you will probably want to turn this off later.
New SNMP Trap event collection rule:

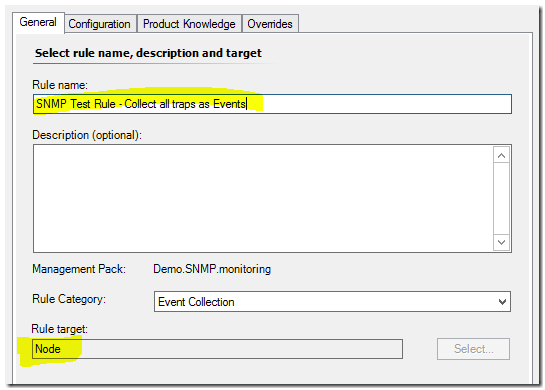
Give your rule a name, and target class MUST BE “Node”
For the configuration of the SNMP trap provider – you can leave this blank – it will then match on all:

Click Create.
Now – create an event view in the Console in our management pack for SNMP monitoring, and configure it to show data related to Node:

Nice – now we need to export our MP to XML, and do a very specific edit. This is outlined at: http://blogs.msdn.com/b/wei_out_there_with_system_center/archive/2014/02/15/opsmgr-customizing-the-snmp-trap-collection-rule-for-all-snmp-version-traps.aspx
When we receive traps by default – we ONLY accept taps in the same SNMP version as we discovered the device in. This is not really optimal, because some devices send SNMP v1 traps but are discovered as an SNMP v2 device. We can strip this filter from the XML by finding our rule, and removing the lin defining “Version”:
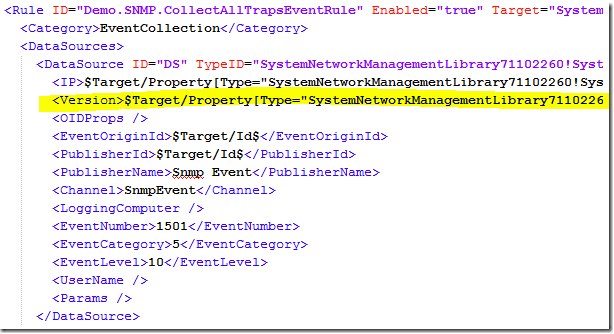
Delete that entire line containing Version to remove this as a filter for the rule:

Now increment the XML version of the MP in the Manifest section, and re-import the MP. This will limit confusion and SNMP version issues down the road.
Lets’ take a recap:
1. We ensured SNMP Trap service is not running on the SCOM server.
2. We created a resource pool and community string run as account for network monitoring.
3. We discovered our network device that will send us SNMP Traps.
4. We created a “catch all traps” event rule to collect all SNMP traps received as events.
Next up – we should send some SNMP traps from the Ubuntu server to the SCOM server:
The command line to send a SNMP V2 trap would be something like this:
sudo snmptrap -v 2c -c public 10.10.10.11 “” .0.1.2.3.4 0.1.2.3.5 s “string one” 0.1.2.3.6 int 12345
That is basically stating to run the snmptrap command, with a SNMP V2 version, public community string, ip address of the remote SCOM server, two double quotes to encapsulate “uptime” value (a require parameter), and then a trap OID, which I just made up as .0.1.2.3.4. I then added a string and integer varbind.
The command to send an SNMP V1 trap would look something like this:
sudo snmptrap -v 1 -c public 10.10.10.13 ‘1.2.3.4.5.6’ 10.10.10.44 6 99 ” 0.1.2.3.4 s “string one” 0.1.2.3.5 s “string two”
10.10.10.13 is destination, 10.10.10.44 is the source (Ubuntu server) All the rest is just incremental varbind strings.
If we did everything right, we should be able to see this TRAP on a network trace.
If you have problems – DON’T COPY and PASTE the lines above. Copying often pastes in the wrong “” and – characters, so if you Linux session throws errors with you SNMPTRAP syntax – type it out manually.
I will use Wireshark to see this. Install wireshark on the SCOM server, and start it up. You can create a filter to ONLY see traffic to and from your Ubuntu server by using this filter:
ip.addr==10.10.10.44 (or whatever your Ubuntu server IP is)

Send a trap from your Ubuntu server or network device, and you should see it register in Wireshark:
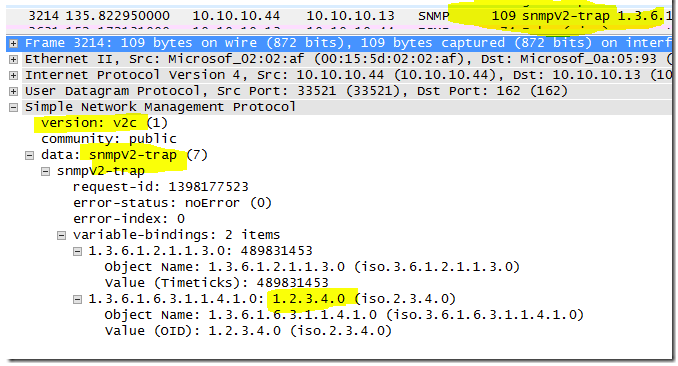
If everything went perfectly – you will also see this collected as an event in SCOM:

Click the “View Event Data” to see how SCOM breaks down each dataitem:
I will format this out a little better to make it more understandable:
<EventData>
  <DataItem type="System.SnmpData" time="2015-02-03T11:44:01.6480756-06:00" sourceHealthServiceId="BA5D0090-EDAA-EFF4-10BB-3882E6B231E0">
  <Source>10.10.10.44</Source>
  <Destination>127.0.0.1</Destination>
  <ErrorCode>1</ErrorCode>
  <Version>2</Version>
    <SnmpVarBinds>
      <SnmpVarBind>
        <OID>.1.3.6.1.2.1.1.3.0</OID>
        <Syntax>67</Syntax>
        <Value VariantType="19">489831453</Value>
      </SnmpVarBind>
      <SnmpVarBind>
        <OID>.1.3.6.1.6.3.1.1.4.1.0</OID>
        <Syntax>6</Syntax>
        <Value VariantType="8">.1.2.3.4.0</Value>
      </SnmpVarBind>
    </SnmpVarBinds>
  </DataItem>
</EventData>
This is important, if we want to manipulate the data, or create further filters/condition detections. Note the SNMPVarBinds – these are essentially event parameters in an SNMP Trap event. (more on this later)
Next up – lets create a generic Alert rule for SNMP traps, which will help us in testing and troubleshooting future more specific alert rules.
Create an Alert generating SNMP trap rule:
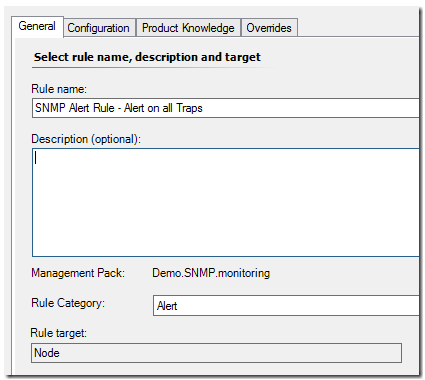
Leave OID blank:

Configure your alert page like this:

Notice in the Alert description – you can gather each data item associated with a specific OID like an event parameter. This will help us create better, filtered alerts later.
Save the new Alert Rule. Don’t forget to export the MP and delete the line with the <Version> filter in it for V1 vs V2 SNMP traps.
Also – create a new view in our MP, for Alerts. Scope it to “Node” class so we will see open alerts for SNMP traps.
Now – when we create a trap on the Ubuntu server, we should collect it as an event, AND alert on it. This time, on the trap command line, lets add two more OID’s to the trap to simulate a more realistic trap:
snmptrap –v 2c –c public 10.10.10.13 “” .1.2.3.4.0 .1.2.3.4.0.1 int 12345 .1.2.3.4.0.2 int 67890

Event Collected:

Alert Generated:

Notice in the alert – the alert description variables we added previously help us interpret which SNMP Varbind (parameter) is which. In the collected event, it breaks down like this:
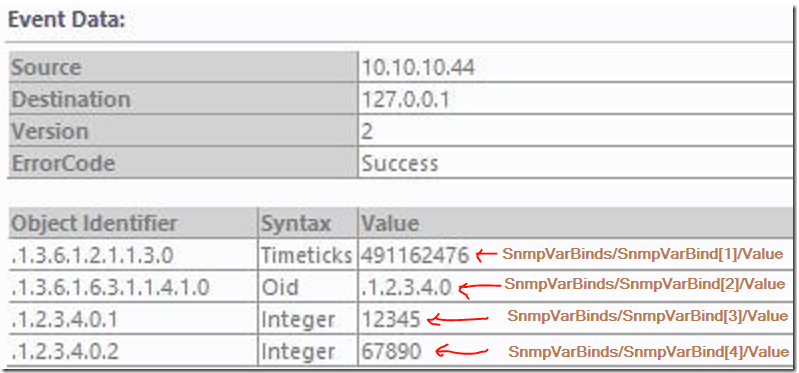
You can also express this based on the OID in an Xpath query, such as:
SnmpVarBinds/SnmpVarBind[OID=”.1.2.3.4.0.1″]/Value
See more on this at: https://technet.microsoft.com/en-us/library/hh563870.aspx
Ok, next up – lets build an alert rule based on a specific OID.
Create a new alert rule, and this time lets input the specific OID of our test trap, “.1.2.3.4.0”
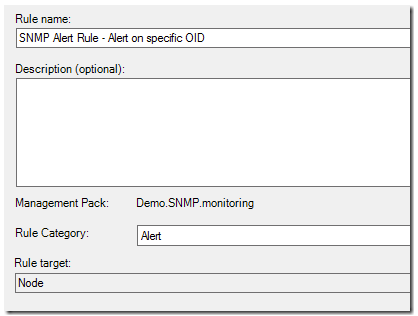

And customize the alert description as before:

Now – when we send a trap based on OID .1.2.3.4.0 this workflow will alert, but a trap based on .1.2.3.4.1 will not:

However, what if we want to get even more specific? What if the OID of a trap is generic in nature, and there is data inside a trap that we want to alert ONLY when that data inside a trap matches specific criteria?
In this case, we need to add a condition detection to a rule. I could not find any examples of how to do this on the web, and for some reason we don’t have a built in datasource which allow for SNMP trap data and a simple expression filter. We could create an advanced composite datasource for this, and reuse it, but I want to show something much simpler, which still allows you to author the rule in the UI and just make a simple tweak.
So, in this case, we will want to make an alert when the OID is .1.2.3.4.0, and when SNMPVarbind3 (the 3rd parameter down) Equals 12345.
Start by creating the EXACT same rule we did before with a new name:
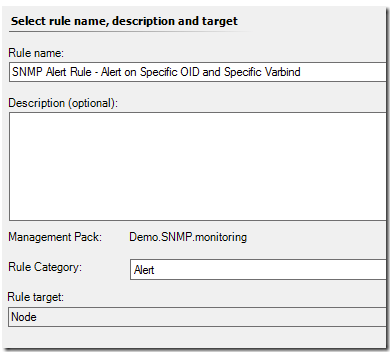

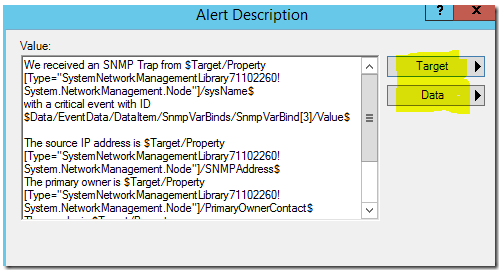
But on the alert description – let’s get a little sexier:
You can use the flyout on the right to create these:

Now – we need to export this MP to XML and do a manual edit.
Increment the version in the manifest.
Find the rule with all the sexy alert description stuff we just wrote (hint – look in the write action section of the rule)
We need to insert the following code in between the <Datasource> and the <WriteAction> sections. Here is the code:
   <ConditionDetection ID="FilterSpecificVarbind" TypeID="System!System.ExpressionFilter">
     <Expression>
       <SimpleExpression>
         <ValueExpression>
           <XPathQuery Type="String">EventData/DataItem/SnmpVarBinds/SnmpVarBind[3]/Value</XPathQuery>
         </ValueExpression>
         <Operator>Equal</Operator>
         <ValueExpression>
           <Value Type="String">12345</Value>
         </ValueExpression>
       </SimpleExpression>
     </Expression>
   </ConditionDetection>
Rule before:
      <Rule ID="Demo.SNMP.monitoring.AlertOnTrapOidAndVarbind" Enabled="true" Target="SystemNetworkManagementLibrary71102260!System.NetworkManagement.Node" ConfirmDelivery="false" Remotable="true" Priority="Normal" DiscardLevel="100">
        <Category>Alert</Category>
        <DataSources>
          <DataSource ID="DS" TypeID="SystemNetworkManagementLibrary71102260!System.NetworkManagement.SnmpTrapEventProvider">
            <IP>$Target/Property[Type="SystemNetworkManagementLibrary71102260!System.NetworkManagement.Node"]/SNMPAddress$</IP>
            <Version>$Target/Property[Type="SystemNetworkManagementLibrary71102260!System.NetworkManagement.Node"]/SNMPVersion$</Version>
            <OIDProps>
              <OIDProp>.1.2.3.4.0</OIDProp>
            </OIDProps>
            <EventOriginId>$Target/Id$</EventOriginId>
            <PublisherId>$Target/Id$</PublisherId>
            <PublisherName>Snmp Event</PublisherName>
            <Channel>SnmpEvent</Channel>
            <LoggingComputer />
            <EventNumber>1501</EventNumber>
            <EventCategory>5</EventCategory>
            <EventLevel>10</EventLevel>
            <UserName />
            <Params />
          </DataSource>
        </DataSources>
        <WriteActions>
          <WriteAction ID="Alert" TypeID="Health!System.Health.GenerateAlert">
            <Priority>1</Priority>
            <Severity>0</Severity>
            <AlertName>SNMP Alert Rule - Alert on Specific OID and Specific Varbind</AlertName>
            <AlertDescription>We received an SNMP Trap from {0}
with a critical event with ID {1}

The source IP address is {2}
The primary owner is {3}
The vendor is {4}
The location is {5}</AlertDescription>
            <AlertOwner />
            <AlertMessageId>$MPElement[Name="Demo.SNMP.monitoring.AlertOnTrapOidAndVarbind.AlertMessage"]$</AlertMessageId>
            <AlertParameters>
              <AlertParameter1>$Target/Property[Type="SystemNetworkManagementLibrary71102260!System.NetworkManagement.Node"]/sysName$</AlertParameter1>
              <AlertParameter2>$Data/EventData/DataItem/SnmpVarBinds/SnmpVarBind[3]/Value$</AlertParameter2>
              <AlertParameter3>$Target/Property[Type="SystemNetworkManagementLibrary71102260!System.NetworkManagement.Node"]/SNMPAddress$</AlertParameter3>
              <AlertParameter4>$Target/Property[Type="SystemNetworkManagementLibrary71102260!System.NetworkManagement.Node"]/PrimaryOwnerContact$</AlertParameter4>
              <AlertParameter5>$Target/Property[Type="SystemNetworkManagementLibrary71102260!System.NetworkManagement.Node"]/Vendor$</AlertParameter5>
              <AlertParameter6>$Target/Property[Type="SystemNetworkManagementLibrary71102260!System.NetworkManagement.Node"]/Location$</AlertParameter6>
            </AlertParameters>
            <Suppression />
            <Custom1 />
            <Custom2 />
            <Custom3 />
            <Custom4 />
            <Custom5 />
            <Custom6 />
            <Custom7 />
            <Custom8 />
            <Custom9 />
            <Custom10 />
          </WriteAction>
        </WriteActions>
      </Rule>
Rule after:
      <Rule ID="Demo.SNMP.monitoring.AlertOnTrapOidAndVarbind" Enabled="true" Target="SystemNetworkManagementLibrary71102260!System.NetworkManagement.Node" ConfirmDelivery="false" Remotable="true" Priority="Normal" DiscardLevel="100">
        <Category>Alert</Category>
        <DataSources>
          <DataSource ID="DS" TypeID="SystemNetworkManagementLibrary71102260!System.NetworkManagement.SnmpTrapEventProvider">
            <IP>$Target/Property[Type="SystemNetworkManagementLibrary71102260!System.NetworkManagement.Node"]/SNMPAddress$</IP>
            <Version>$Target/Property[Type="SystemNetworkManagementLibrary71102260!System.NetworkManagement.Node"]/SNMPVersion$</Version>
            <OIDProps>
              <OIDProp>.1.2.3.4.0</OIDProp>
            </OIDProps>
            <EventOriginId>$Target/Id$</EventOriginId>
            <PublisherId>$Target/Id$</PublisherId>
            <PublisherName>Snmp Event</PublisherName>
            <Channel>SnmpEvent</Channel>
            <LoggingComputer />
            <EventNumber>1501</EventNumber>
            <EventCategory>5</EventCategory>
            <EventLevel>10</EventLevel>
            <UserName />
            <Params />
          </DataSource>
        </DataSources>
        <ConditionDetection ID="FilterSpecificVarbind" TypeID="System!System.ExpressionFilter">
          <Expression>
            <SimpleExpression>
              <ValueExpression>
                <XPathQuery Type="String">EventData/DataItem/SnmpVarBinds/SnmpVarBind[3]/Value</XPathQuery>
              </ValueExpression>
              <Operator>Equal</Operator>
              <ValueExpression>
                <Value Type="String">12345</Value>
              </ValueExpression>
            </SimpleExpression>
          </Expression>
        </ConditionDetection>
        <WriteActions>
          <WriteAction ID="Alert" TypeID="Health!System.Health.GenerateAlert">
            <Priority>1</Priority>
            <Severity>0</Severity>
            <AlertName>SNMP Alert Rule - Alert on Specific OID and Specific Varbind</AlertName>
            <AlertDescription>We received an SNMP Trap from {0}
with a critical event with ID {1}

The source IP address is {2}
The primary owner is {3}
The vendor is {4}
The location is {5}</AlertDescription>
            <AlertOwner />
            <AlertMessageId>$MPElement[Name="Demo.SNMP.monitoring.AlertOnTrapOidAndVarbind.AlertMessage"]$</AlertMessageId>
            <AlertParameters>
              <AlertParameter1>$Target/Property[Type="SystemNetworkManagementLibrary71102260!System.NetworkManagement.Node"]/sysName$</AlertParameter1>
              <AlertParameter2>$Data/EventData/DataItem/SnmpVarBinds/SnmpVarBind[3]/Value$</AlertParameter2>
              <AlertParameter3>$Target/Property[Type="SystemNetworkManagementLibrary71102260!System.NetworkManagement.Node"]/SNMPAddress$</AlertParameter3>
              <AlertParameter4>$Target/Property[Type="SystemNetworkManagementLibrary71102260!System.NetworkManagement.Node"]/PrimaryOwnerContact$</AlertParameter4>
              <AlertParameter5>$Target/Property[Type="SystemNetworkManagementLibrary71102260!System.NetworkManagement.Node"]/Vendor$</AlertParameter5>
              <AlertParameter6>$Target/Property[Type="SystemNetworkManagementLibrary71102260!System.NetworkManagement.Node"]/Location$</AlertParameter6>
            </AlertParameters>
            <Suppression />
            <Custom1 />
            <Custom2 />
            <Custom3 />
            <Custom4 />
            <Custom5 />
            <Custom6 />
            <Custom7 />
            <Custom8 />
            <Custom9 />
            <Custom10 />
          </WriteAction>
        </WriteActions>
      </Rule>
Now import this MP back in, and test your traps.
When we send a trap that contains both the OID and the data in Varbind3, we should get a very specific alert, with a nice Alert Description pulling from data within the trap:

Summary:
1. We ensured the SNMP Trap service is not running on the SCOM server
2. We created a resource pool and community string run as account for network monitoring.
3. We created an Ubuntu server to send test SNMP traps from.
4. We discovered our network device that will send us SNMP Traps.
5. We created a “catch all traps” event rule to collect all SNMP traps received as events.
6. We modified our rules to strip the SNMP <Version> filter from them so we can receive traps of any version.
7. We demonstrated using Wireshark to validate that SNMP traps are received by the network interface.
8. We create an alert rule to alert on all traps, and modified the alert description to show the SNMP Varbinds and how they related to data collected in a SNMP trap event.
9. We created an alert rule for specific OID’s in a SNMP Trap.
10. We created an alert rule that matches on OID and specific dataitems within the SNMP Trap data, with a rich alert description
I will attach my example MP to this article.

Hello Kevin,
thanks for this helpful article. Does SCOM also work with SNMPv3 trapping?
I don’t know – I really dont have any experience with SNMPv3.
Hi Kevin,
Has SNMP trap collection changed at all in SCOM 2019? Are there any improvements to network monitoring in SCOM 2019?
No changes that I am aware of in Network Monitoring
Hi Kevin,
If we have 2 Servers listed in the Resource Pools for NetWork Monitoring, will we receive 2 traps Alerts in SCOM for the same Error condition?
No. the object (node) will only be hosted on one of them.
Hi Kevin, thank you very much for this article. It was very instrumental in helping me understand how SCOM manages snmp data. Can you briefly explain how you might leverage what you have shown us here with a MIB file? i.e. create alerts based on the MIB provided by the manufacturer?
Hi Kevin, I would say thanks for all your post. this is the first time i can resolve a problem with your post. Im trying this but never receive any event or alert.
I have 2 network devices discovered and working
I use Microsoft network monitor to check the traps and I can see them from there.
But SCOM no, any clue
I have SCOM 2012 R2
Windows server 2008 R2
Please forget about early message, is now working. Im having this problem now:
I have my network devices discovered and healty, now im trying to get traps fro them followinf the following article:
https://kevinholman.com/2015/02/03/snmp-trap-monitoring-with-scom-2012-r2/
everything is configured as is in article, but no event traps or alert traps.
I have Microsoft network monitor in management server and i can get traps from there:
Frame: Number = 86554, Captured Frame Length = 194, MediaType = ETHERNET
Udp: SrcPort = SNMP(161), DstPort = 53831, Length = 160
SrcPort: SNMP(161)
DstPort: 53831
TotalLength: 160 (0xA0)
Checksum: 38709 (0x9735)
UDPPayload: SourcePort = 161, DestinationPort = 53831
Hi Kevin,
thanks for the article. Its really helpful.Can you please confirm if it also works for Win network device the way it worked for Linux device?
Thanks
Yes, it does, but you have to do some editing to discover Windows devices as a network device:
https://kevinholman.com/2015/12/16/how-to-discover-a-windows-computer-as-a-network-device-in-scom-2012/
Hello Kevin,
Thanks for the Artical.
As i have configured as suggested by you and traps are getting in the SCOM But when i am sending trap message from other monitoring tools redhat machine (snmp server) is not getting that message or not not able to store that locally . how we can configure that .
Hi Kevin,
I have a question i am trying to monitor a fault raised from an network devices i have the OID whats the best way to monitor this OID whenever its raised can we do this in SNMP_MP_GENERATOR_TOOL if so what is the best option to do this will this come under components monitor ? please suggest
Thanks Kevin,
May I know if performance report can also be generated for such Linux devices discovered as a network device in SCOM, please.
Thanks
Sky
Hi Kevin,
The Clearswift SEG (Secure gateway) Redhat based appliance send the SNMP trap to windows server 2019 and we are trying to get the SNMP event /alert from windows server but we are not able to see the alerts in SCOM. The SNMP service is enable in windows server.
We have tried by discovering the windows system as network device and its discovered and alert rule configured for port active based on MS site article but we are getting the alert
Also we have installed SCOM agent on Windows server and its status is healthy .
We tried to send the SNMP Test trap from SEG server and its reaching windows server(able to through wireshark) but not able to see any alert in SCOM console.
Could you please help me to how to achieve to get alert in SCOM for SEG appliance through windows server.
Hi,
How can we set alert suppression for SNMP alerts?
Thanks.
Hello Kevin!
Thank you for your manual.
We have two Server in ResourcePool. If the active Server for Trap-Receiving is switched, we don’t get a very long time (3 – 5 minutes) no traps!
with wireshark we see the traps, but not in scom.
is their a possibility to speed up the switch to the other server?
thanks
Hi Kevin,
I have configured one of our ups device with a community string and is succesfully added to SCOM. Moreover, SCOM is intergrated with Service now. However, when i do a test trap the alerts are not raised and tickets are not getting generated. Is there any way i can configure for the traps to be raised as alerts which then generates a ticket in Snow?
Hi Kevin,
We have successfully created SNMP string for UPS devices( APC and Eaton) as we would like to monitor it using SCOM. However, after successful configuration we were trying to test if the alerts are getting generated in SCOM using test trap from the device web interface. When we run the test trap events are created in SNMP alert in SCOM , but alerts are not generated as I assume by default alerts are not generating for test trap.
IS it possible to create a new rule which creates an alert for the test trap and then creates a ticket in service now (SCOm alreday integrated with Service now)
Thanks
Sree