This is probably the single biggest issue I find in 100% of customer environments.
Year ago, I wrote about this issue, where the SCOM agent in some cases can consume above typical resource levels of memory, handles, etc. When this occurs – we will restart the agent to kill any “runaway” processes.
One of the things I have noticed, is that on many of my servers, these thresholds are being breached on a regular basis – mostly due to the monitoringhost.exe processes needing to use more than the default of 300mb of RAM (private bytes).
The issue is, that you will likely have NO idea this is happening. We don’t generate any alerts for this by default – we simply “fix the problem” by creating a state change, then running a response script to bounce the agent. The REALLY bad part about this, is you could have agents in a constant restart loop.
Customers often have hundreds of agents in a constant restart loop, filling the SCOM DB with state change events and barely monitoring the systems because the agent is always in a restart loop. Additionally, the agent eventually fails to start back up, resulting in a heartbeat failure.
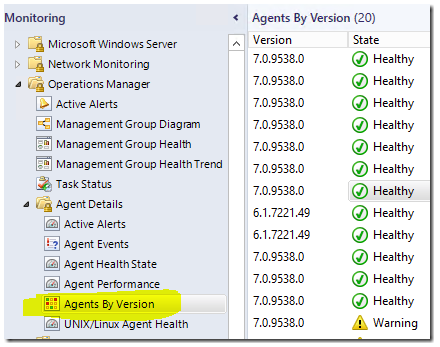
In SCOM 2012 – I recommend making the following changes via overrides: Open the “Operations Manager > Agent Details > Agents by Version” view in the console:
Open health explorer for one of the agents – and here is an example of an agent that has been bouncing on a regular basis:
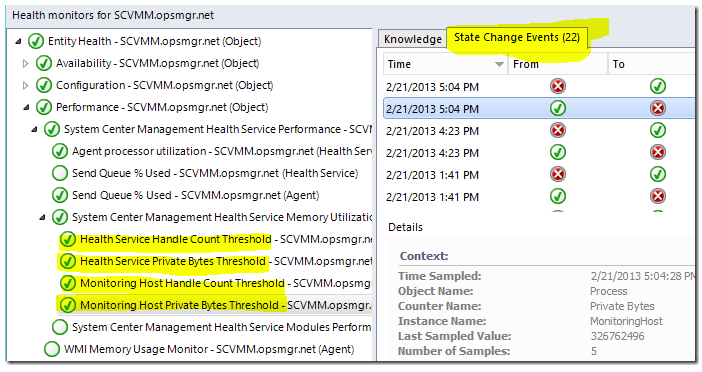
I recommend the following:
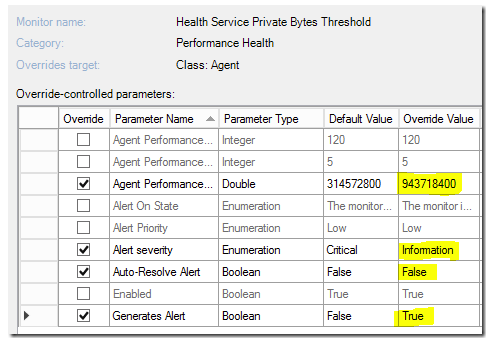
Private bytes monitors should be set to a default threshold of 943718400 (up from the default of 300MB)
Handle Count monitors should be set to 30,000 (the default of 6000 is WAY low)
In addition, on each monitor:
Override Generate Alert to True (to generate alerts)
Override Auto-Resolve to False (even though default is false, this must be set, to keep from auto-closing these so you can see them and their repeat count)
Override Alert severity to Information (to keep from ticketing on these events)
——————–
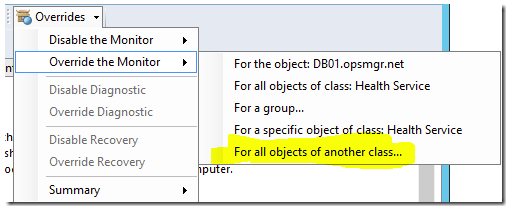
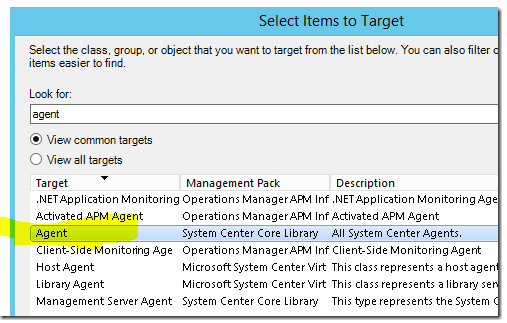
Override EACH monitor, “all objects of another class” and choose “Agent” class.
This is a good configuration:



As a refresher – this will be common on any monitored systems that discover a large number of instances – such as Exchange, DNS, SQL servers, SCVMM, large web servers, etc.

Hi Kevin,
Good Morning !!
I have overridden the vales as per this KB article .still we are receiving “Microsoft.SystemCenter.Agent.MonitoringHost.PrivateBytesThreshold” alert in 10 time per day on 5 servers. please suggest new value to stop this alert . we are using SCOM 2012 R2
Last sampled value generated alert
Time Sampled: 10/19/2021 8:17:19 AM
Object Name: Process
Counter Name: Private Bytes
Instance Name: MonitoringHost
Last Sampled Value: 1700810752
Number of Samples: 5
Thanks
Unless these are management servers – something is WRONG and you need to investigate why they are using so much memory.