In OpsMgr 2012 we have enhanced the capabilities around network monitoring. In this article I will demonstrate how to discover and monitor a network device.
This is also covered in great detail at: http://technet.microsoft.com/en-us/library/hh205982.aspx
Launch the discovery wizard and select Network Devices:

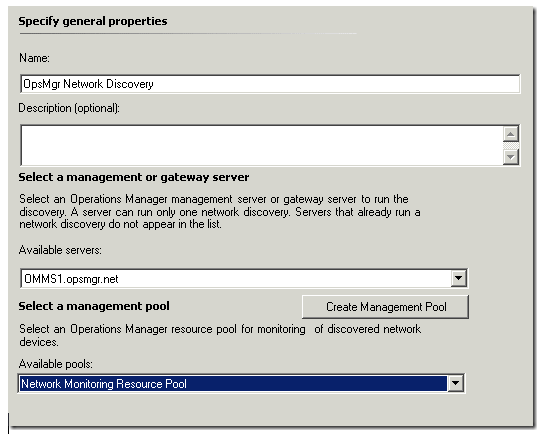
Give a name for your discovery cycle, select the management server that you want to handle the network device discovery, then choose a resource pool. If you want only specific management servers or gateways, you can create a custom resource pool as I have done below, named “Network Monitoring Resource Pool”
Next up choose explicit discovery, or recursive. Since I am targeting a specific device, I will choose explicit. If you didn’t know all your managed network devices and wanted to discover them by reading the ARP cache of each discovered device, you can choose recursive.
Create a RunAs account. In this case – the RunAs account for network devices is simply the SNMP Community string. You can create as many as you need. I am just using the default which is “public” so I will create that.


Next up I click “Add” and type in the IP address of my router, leaving the rest at default settings.


Next I need to pick a schedule, if I want this discovery to run on a regular basis, and pick up and discover/monitor newly added network devices. For this example – I will choose to run manually.
Create the discovery, and you will see the following popup:
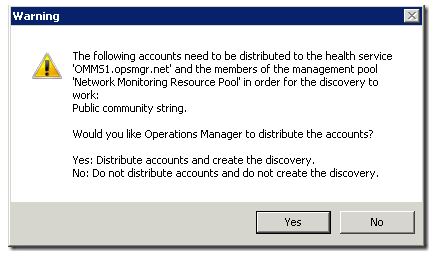
Choose YES to continue – this will automatically distribute the community string based RunAs account to any management servers in your resource pool, and to the management server you chose to execute the discovery.
In the admin console – you can see your newly created discovery rule:

You can follow the discovery process in the event log of the Management Server where you assigned discovery to run:

After a few minutes if discovery was a success – you will see your network device show up in the Admin console, under Network devices. Take note of the Certification value – if it states CERTIFIED it means the devices was recognized by the OpsMgr network equipment database and we will apply specific monitoring for that device.

Back in the monitoring pane – select Network Devices – and you will see we have discovered your device. In this case – I have a Cisco 1605 branch office access router:

Open Health Explorer for the device and you can see the out of the box monitoring provided for this specific discovered device:
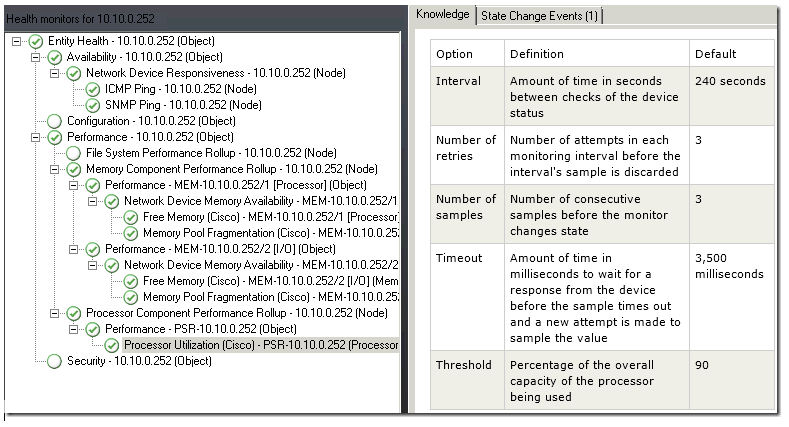
For my device – we monitor ICMP and SNMP availability (as long as one of those is available we consider the device “up”)
Free memory, and memory pool fragmentation, and additionally CPU utilization monitoring.
We will also begin collecting performance data in the warehouse for each device, similar to the statistics that we monitor out of the box, such as memory, CPU, power supply, temperature and voltage sensors, and fans.

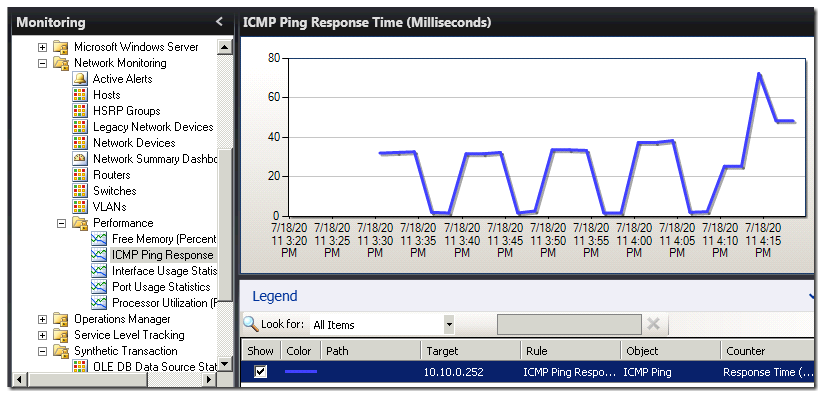
Taking use of the new Dashboards in OpsMgr 2012 – there is a network node dashboard that will give us a lot of cool “at a glance information” about this Network device:

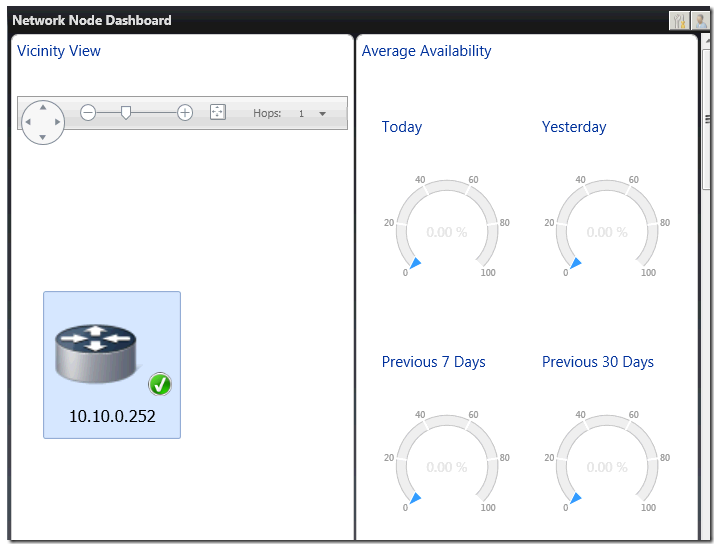
Done!

Kevin, I am struggling here with this. I am trying to accomplish a basic discovery for two cisco 2960x switches. have snmp 161 udp open between the scom servers(lab) and the switches, as well as icmp. icmp discovery only comes back great, however, snmp fails. When I look under monitoring\networking monitoring\host, I see green check marks and the two devices listed, accessmode=icmp only, port 161, supports snmp False. In your experience, would this indicate that even though the snmp ports are open, that the switches are not configured properly for snmp? I have attempted snmp v1,2 and v3 with no success.
However, when I run wireshark, filter it by ip of the switch, I see get-request items(but no responses??) and variable bindings:
1.3.6.1.2.1.1.1.0
1.3.6.1.2.1.1.2.0
1.3.6.1.2.1.1.4.0
1.3.6.1.2.1.1.5.0
1.3.6.1.2.1.1.6.0
I know it is really vague, just looking for where to go next?
Regards,
TS
I usually go get a simple/free SNMPWalk tool – and attempt to walk the SNMP connection to the device. If it doesn’t respond – there is your issue.
I’m having trouble getting results from AIX/Linux servers when I do the SNMP discoveries.
I get no data and the reason states “No Response from SNMP”
What can I do to get this to provide results? thanks
have you ever seen a network device show as CERTIFIED but dont get any of the goods like fan, cpu, disk, ram, etc, etc? seems like all i can see is ping response time.
like dave mentioned all i can see is ping response time. not anything related to fan cpu memory disk is monitored for my cisco ucs snmp
I’m having issues discovering a Meraki device in SCOM. It returns with “No Response SNMP”. I am using SCOM 2019
I have a MIB Browser, which I can GET and walk most properties on the device using the same community string that I am using from SCOM.
Admittedly it seems to be a bit hit and miss. At first it seemed to fail getting some when doing a WALK, including the System Uptime (both GET and WALK) but has since worked ok. Possibly a timeout issue.
But I can’t understand why the tool can get this but SCOM fails. Some GET’s return no object, but I assume that shouldn’t stop the base discovery from adding the device initially in SCOM?
Is there anything specific that the discovery performs, such as mandatory OID’s before it will add the device?
Thanks
Andrew
i have added 150 Network devices in SCOM and SCOM is creating logical ports. How to get alerts with physical port number instead of logical port.
Hello kevin
thank you for your great work.
i have one question???? How we can import a list of servers from csv with required information here any idea or example
Hi Kevin, We have corrupt Network Device Discovery Rule which is not editable and giving error “One or more accounts used by the discovery rule could not be found. Please delete the discovery and recreate it” .
Curious to understand if deleting the discovery rule will have any impact on the network devices being monitored. can we delete and recreate the same discovery rule?
Please suggest the right approach.
Does the network monitoring work from the gateway server instead of the management server?