In my previous post similar to this topic, we discussed how to check for the existence of a registry key or value, and alert/change state if it was missing. But what if you want to inspect the contents of a registry value for specific data?
For instance – what if we want to inspect a specific critical service, and ensure it is always set to “Automatic” startup? Or perhaps we have a custom registry value that should always be set to a range of specific integers or string values, and we want to know if it exists, but it not set correctly?
This post will be an example of how to create a custom MonitorType to do that, very similar to how we did for existence. I recommend starting with the previous post for greater details, as this article will leverage the same process.
Scenario: We have a policy that we stamp the registry on all machines with the HKLM\Software\CompanyX key. Within that Key – we have a Reg Value named “ServerLevel” which will be a number, 1 through 4. Level 1 servers are critical production, level 2 servers are production, level 3 are pilot, and level 4 are development. We use these values to dynamically assign these servers to custom groups in OpsMgr, for the purpose of scoping notifications, paging, and ticketing, as described HERE. The goal of this monitor will be to ensure this value has been set, between 1 and 4. The purpose is to ensure we don’t have servers that are unset, as they will not get put into the appropriate group and we could miss some critical monitoring.
We want a monitor for this, and since no existing MonitorType exists – we will need to create one.
Create a new Empty Management Pack.
(ExampleMP)
In your custom management pack, using the Authoring Console, create a new Composite MonitorType.
(ExampleMP.RegValueMonitorType)
On the General tab – give the MonitorType a display name.
(Custom – Check Existence of RegKey Monitor Type)
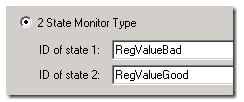
On the States tab – we need to define the state names we want.
On the Member modules tab: We need to add 3 things for this example. A datasource to the registry data we need, and two condition detections (one for good (RegValueBad) and one for bad (RegValueGood).
Click Add, and find the “Microsoft.Windows.RegistryProvider” Data Source. In the ModuleID – this can be anything you want. Most people just type DS (for DataSource). I will type in “RegDS” for mine:
We used the Microsoft.Windows.RegistryProvider because this was a good existing Data Source module that has the ability to inspect the registry and has a schedule timer module as well. To read about all the available modules, check out the TechNet Module Types Reference
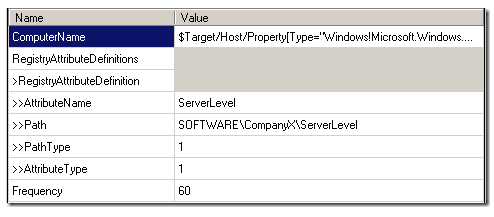
On the RegDS Configuration – we have several items we need to input.
For ComputerName – change the default text to: “$Target/Host/Property[Type=”Windows!Microsoft.Windows.Computer”]/NetworkName$” (no quotes) This is a variable which will tell the workflow to connect to the local computer’s registry where it is running. Described HERE
For AttributeName – this is just a text name to give the attribute of our Reg Key, I will call mine “ServerLevel” since that is the name of the Reg Value. Described HERE
For Path – this is the path to the custom reg value. HKLM is assumed – so you will need to add “SOFTWARE\CompanyX\ServerLevel”. Described HERE
For PathType – this is “0” for a key, and “1” for a value. We are inspecting a value in this case so ours will be “1”. Described HERE
For Attribute Type – this is the data type to return to the workflow, we will use “1” – for String. Generally – we want to match whatever the datatype is in the registry. If the registry value was a REG_DWORD, we would use integer. You can collect a string as an integer, but if ever an integer is not present, the workflow will not work and OpsMgr will throw an error. The options are described HERE
For Frequency – we should input 86400 (this is seconds = 1 day).
For testing in small labs you can set this to be more frequent, just be careful in production with aggressive monitoring on short frequencies.
That completes our datasource! Next up – add two condition detections.
On the Member Modules tab, click Add, and add the System.ExpressionFilter. Give our condition detection an ID at the bottom. I will use “CDGood” for this one.
This condition detection type of System.ExpressionFilter is just a simple filter to be able to add conditional criteria to the output of our monitor type.
For the Expression of this Condition Detection, hit Configure. Select “Insert”. For the Parameter name – we need the name of the attribute we used in the data source. We used “ServerLevel” so type that in here… but it MUST be prefaced with “Values/” so the final line to be added is “Values/ServerLevel”. Since we want to make sure this is set to 1,2,3 or 4, we will use a regular expression. For the value, we will use the simple regex of ^(1|2|3|4)$ Click OK twice to accept our CD.
Now, back on the Member Modules tab, add another Condition Detection of the same type, but call this one “CDBad”. We will configure this one identical to the above – but will set the Expression to “Values/ServerLevel” and “Does not match regular expression” and “^(1|2|3|4)$”.
On the Regular tab, we need to define the order or operations for each state. On the “RegValueBad” we want the DataSource first, then the Condition Detection for “CDBad”, then output the module data.
Do the same thing for the RegValueGood state, but use the other condition detection for CDGood at the end of the workflow.
Click OK, and our MonitorType is done!
So – we have created our MonitorType. Now we just need to create the monitor that will use this. That part is a LOT easier.
Select the Health Model pane of the Authoring Console.
Select Monitors. Right click > New > Custom Unit Monitor.
Give the Monitor an ID. I chose “ExampleMP.ServerLevelConfiguredMonitor”
Give the Monitor a good Display Name. I chose “Custom – Monitor for ServerLevel setting in Registry”
For the Target, I need this to run on all my Windows Servers, so I like to use “Microsoft.Windows.Server.OperatingSystem” (Windows Server Operating System).
For the Parent Monitor – NEVER accept the default. You always need to choose Availability, Configuration, Performance, or Security. Since this is really a Configuration issue, I choose System.Health.ConfigurationState:
On the Configuration tab – we need to select a MonitorType for this monitor to use. Click “Browse for a Type” and select the MonitorType we previously created.
On the Health tab – we need to define each operational state:
On the Alert tab – you can optionally create an alert when this monitor is in a warning Health state, and configure those typical items.
Click OK, and we are done!
You can now import this MP into your test/dev management group, and begin testing. First – save your MP to a file for backup purposes. Then, from the authoring console > Tools > Export MP to Management Group > Select your Dev MG, and the auth console with import this directly into it for quick testing.
This monitor will change to a Warning state if:
- The reg value “ServerLevel” is missing.
- The reg value exists but has no value set.
- The reg value exists but is set to something other than the expected values.
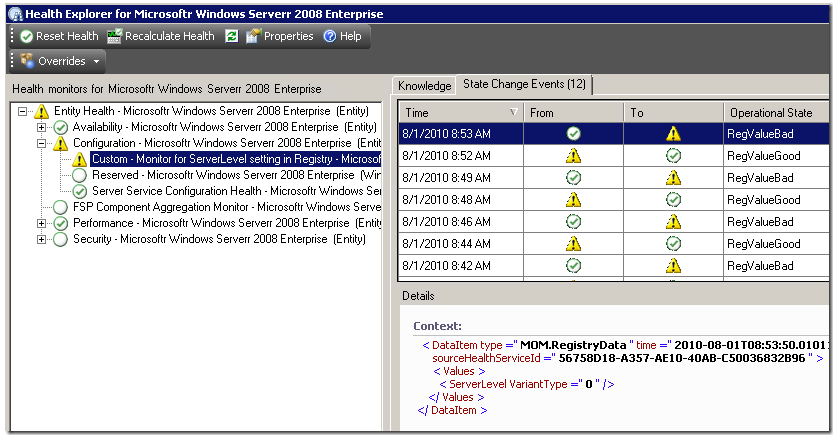
You should see any Windows Server Operating System object that is missing that registry key, turn to a warning state. This should be very clear in health explorer:

Example XML attached.


Does this method still work in SCOM 2019?
I cannot work out how to create a new Composite MonitorType, there no longer seems to be that option?
Many Thanks
Dan
Yes it still works fine. However this tool being demonstrated here is an old SCOM 2007R2 MP Authoring tool. You can download it, or use Fragments and VSAE.
https://kevinholman.com/files/SCOM2007R2AuthoringConsoleReskit.zip
https://kevinholman.com/2016/06/04/authoring-management-packs-the-fast-and-easy-way-using-visual-studio/
Is there still a way to get the xml for this example?