This came up in a discussion group…. and while it maybe not be all that interesting of a topic…. it is interesting to see the kinds of reports you can write with OpsMgr and look for unique scenarios.
The question was – “How can I run a report – and see all my servers that have NOT been logged onto via RDP in the last 30 days?”
First – we need to find out what events are logged, so we can capture which servers ARE being logged on to via RDP. If you have an audit policy that logs successfull logons, we will log an event 528 in the security event log, and the “LogonType” for a RDP logon is “10”.
Here is a link which describes these logon types and what they mean: http://www.windowsecurity.com/articles/Logon-Types.html
So – we want to collect event 528…. but ONLY those events that are RDP… or logon type 10…. so we need to know which Event Parameter that logontype corresponds to, so we can write a rule which will ONLY collect these events. You can use the logparser tool I mentioned here: http://blogs.technet.com/kevinholman/archive/2008/04/22/using-event-description-as-criteria-for-a-rule.aspx
As an alternative – if you don’t want to use LogParser for some crazy reason… you can create an alert generating event rule for all event 528’s, and then in the alert description, simply paste the following – to show you what each parameter in an event equals:
Parameter 1: $Data/Params/Param[1]$ <BR />
Parameter 2: $Data/Params/Param[2]$ <BR />
Parameter 3: $Data/Params/Param[3]$ <BR />
Parameter 4: $Data/Params/Param[4]$ <BR />
Parameter 5: $Data/Params/Param[5]$ <BR />
Parameter 6: $Data/Params/Param[6]$ <BR />
Ok…. so now…. we need to write our event collection rule. It should look something like this:

At this point…. we can run a simple generic “Event Analysis” Report and look for all event 528’s in the Data Warehouse in a given time period. Any servers that DONT show up…. haven’t logged this event.
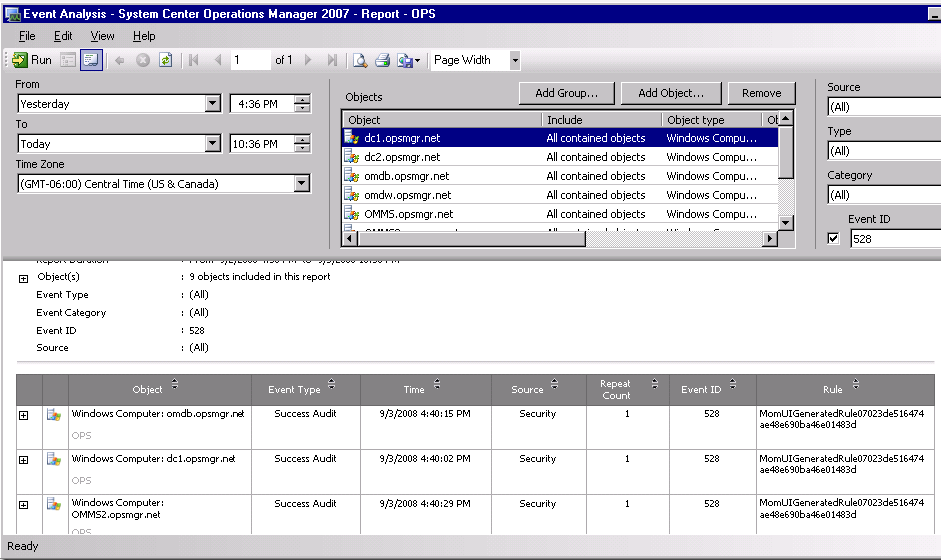
However, what we REALLY want is something that just shows me the list of all machines in the data warehouse that HAVE NOT generated this event…. for that, we can use a custom query:
select distinct elc.computername from Event.vEvent ev
inner join vEventLoggingComputer elc on elc.eventloggingcomputerrowid = ev.loggingcomputerrowid
where NOT eventdisplaynumber = ‘528’
order by elc.computername
Just paste this into a simple visual studio report, add some time/data parameters, and there you have it. In fact – lets walk through that. You can use the copy if Visual Studio that gets installed with the SQL 2005 client tools.
1. Start up visual studio.
2. File, New Project. Choose the Report Server Project Wizard:
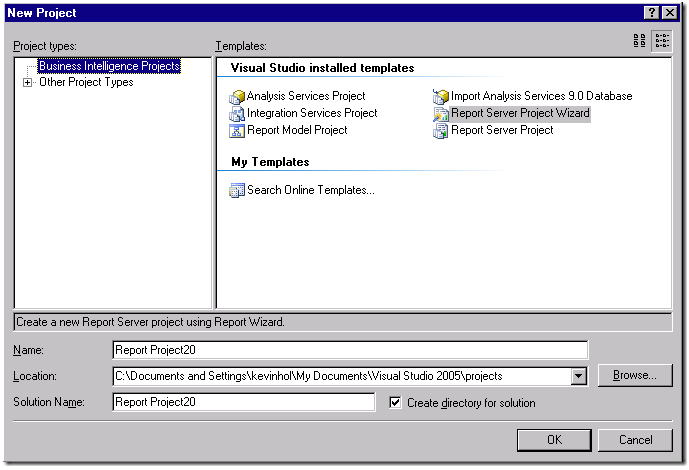
3. Click Next to start the Report Wizard.
4. Create a new Data Source (we will swithc our report to use an existing one later)
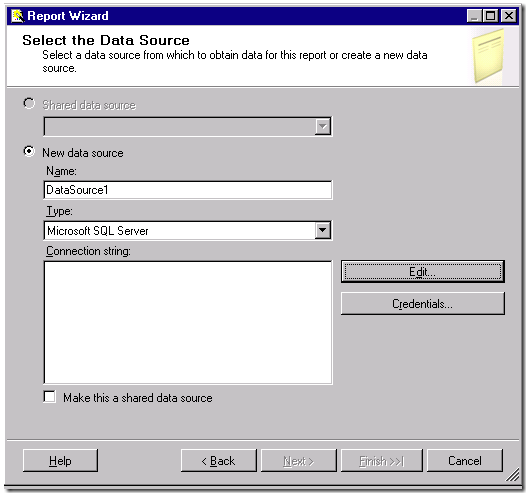
5. Click Edit, and put in the server\instance, and then choose the data warehouse database. Choose Test Connection to make sure it’s all good:
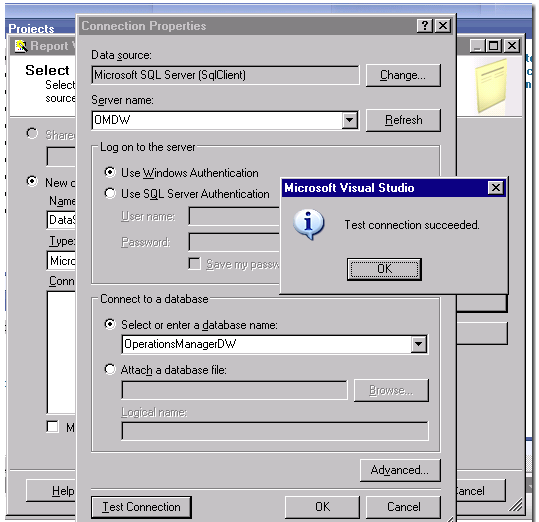
6. Click OK, then Next. Paste in your query that gives you the output you want… from the query I listed above:

7. Click Next, and Finish on Report type.
8. Type a name for the report, such as “Inactive RDP Servers” Check the box to Preview the report.
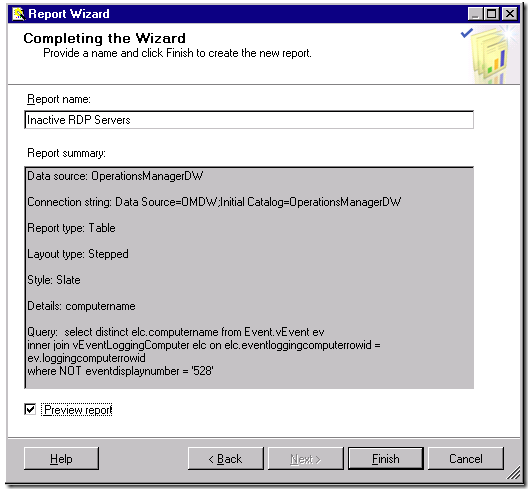
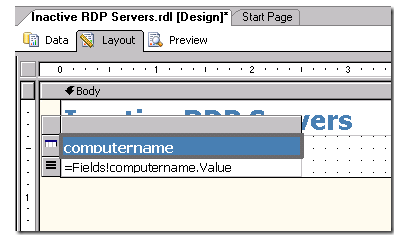
9. Click Finish. The preview comes up. This is a pretty inefficient query, so it might take some time to run in a big datawarehouse. We will need to adjust some of the column widths using a drag and drop function on the layout tab…. the initial formatting is bad. Click the Layout tab, and you can drag the column headers to make the report look good:
10. Now my report looks good…. but I need to add some date/time parameters…. Click the “Data” tab now. From the top menu, choose Report, Report Parameters. Click Add. Add a StartDate and EndDate paramter, and choose DateTime as the data type, exactly as shown:
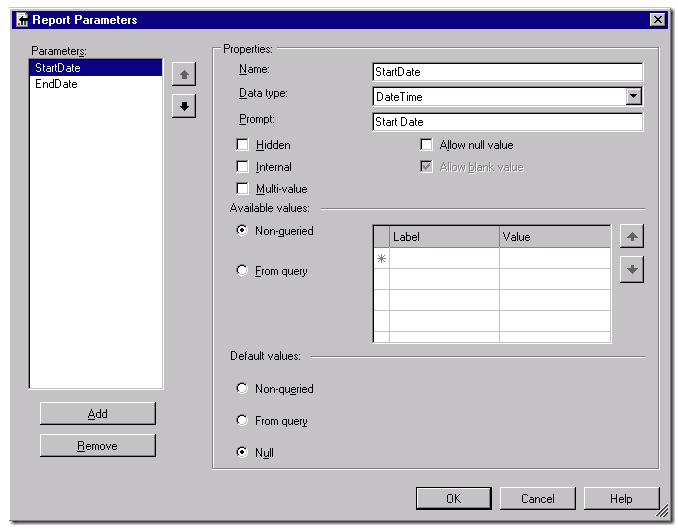
11. Choose OK, and now when you preview your report, you will have some nice date pickers.
12. From the top menu, choose build, build report project. Then browse to your user profile, and find the RDL file we created under \Documents\VisualStudio.
13. You can take this RDL and import it into your reporting website. http://servername/Reports You should create a custom folder there for custom reports. They will automatically show up in the SCOM console.
14. Once you import this file, we need to select it in the reporting website, and update the Data Source.

15. Browse the shared data sources, and select the Data Warehouse Main. Click OK, and make sure you click APPLY on the next screen.
16. Now run your report. Pick a start and end time, and run it – here is mine:

