Many times, we would like to collect information for reporting, or measure and alert on something. Normally, we use Windows Performance Monitors to do this. But, what do we use when a perfmon object/counter/instance doesn’t exist?
This post is an example of how to collect WMI information, and insert it into OpsMgr as performance data. From there we can use it in reports and create threshold monitors.
For starters… we need to find the location of the data in WMI. We can use wbemtest to locate it and test our query.

Hit “Connect” and connect to root\cimv2.
For this example – I am going to look at the Win32_OperatingSystem class.
Using Enum Classes, Recursive, I find the class. I notice the class has a property of “NumberOfProcesses”. That will do well for this example since the output will be an Integer.
I form the query…. select numberofprocesses from win32_operatingsystem

Ok…. we know our WMI query we want…. now lets dive into the console.
We will start by creating a performance collection rule…. for this query output. Authoring pane, Create a New Rule, Collection Rules, Performance Based, WMI Performance.
Give the rule a name (in accordance with your documented custom rule naming standards), then change the Rule Category to “PerformanceCollection”, and then choose a target. I am using Windows Server for this example.

Click Next, and on the WMI Namespace page, enter your namespace, query, and interval. The interval in general should be no more than every 15 minutes, unless you really need a large amount of raw data for reporting. I am using every 10 seconds for an example only…. this is not recommended generally because of the large amount of perf data that will flood the database if we targeted all Agents, or Windows Servers.

The last screen, and most confusing…. is the Performance Mapper. This is where we will give the rule the information it needs to populate the data into the database as ordinary performance data.
First – we need to make up custom names for Object, Counter, and Instance. Just like data from collected from perfmon, we need to supply this…. so I will make up a name for each that makes sense. I will use “NULL” for Instance, as I don’t have any instance for this type of data in my example.
For the Value field, this is where we will input a variable, which represents our query output. In general, following this example, it will be $Data/Property[@Name=’QueryObject‘]$ where you replace “QueryObject” with the name of your instance name that you queried from the WMI class. So for my example, we will use:
$Data/Property[@Name=’NumberOfProcesses’]$

Click “Create” and we are done! How do we know if it is working?
Well, we can create a new Performance view and go look at the data it is collecting:
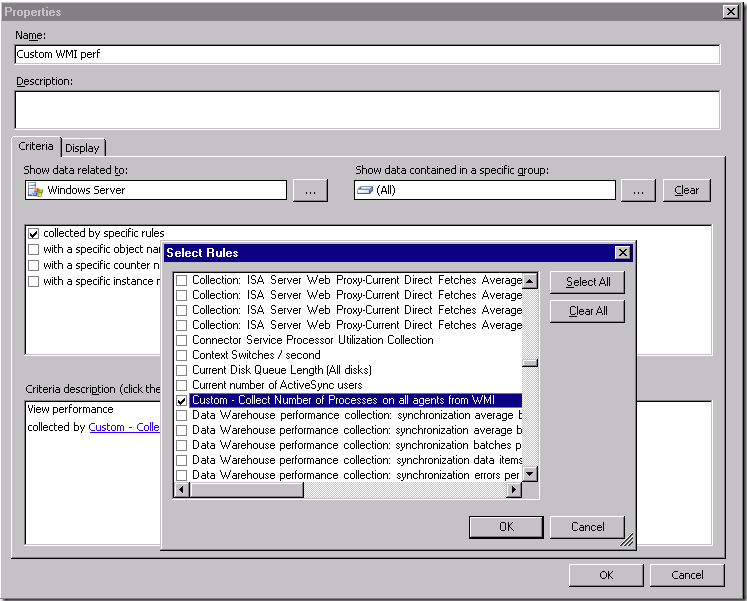
Create a new Custom Performance View in My Workspace. Scope it to Windows Server (or whatever you targeted your rule to). Then check the box for “collected by specific rules” and choose your rule from the popup box. As long as you chose “PerformanceCollection” as the rule category, it will show up here.

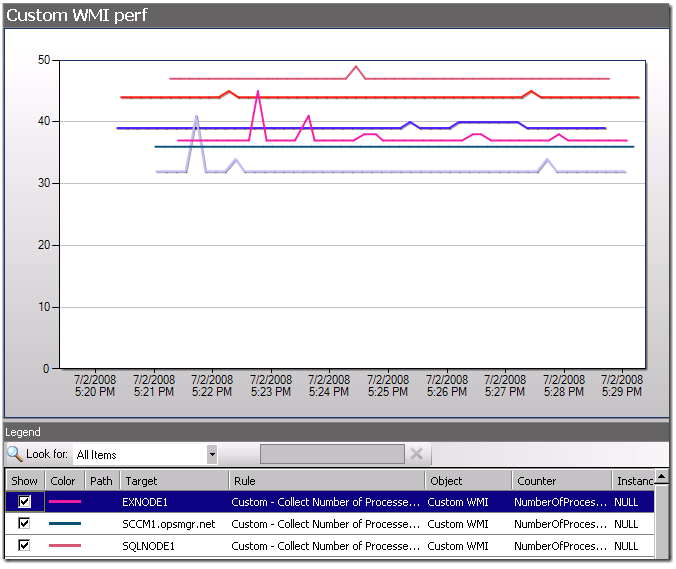
And check out the Performance view – we have a nice snapshot and historical record of number of processes from WMI: Also not the custom performance Object, Counter, and Instance being entered from our rule:

Ok – fun is over. Lets use WMI to monitor for when an agent has more than 40 processes running!
Create a Unit Monitor. WMI Performance Counters, Static Thresholds, Single Thresholds, Simple Threshold. We will fill out the Monitor wizard exactly as we did the Rule above. However, on Interval, since this monitor will only be inspecting the data on an agent, and not collecting the performance data into the database, we can use a more frequent interval. Checking every 1 minute is typically sufficient. Fill out the Performance Mapper exactly as we did above.
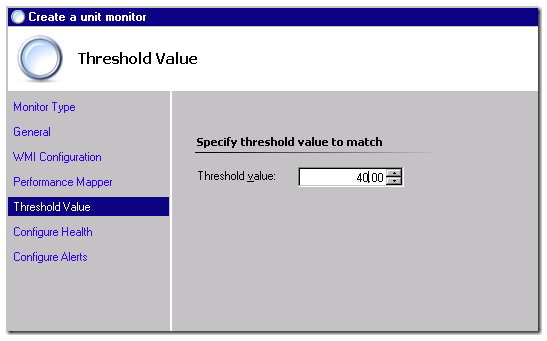
Now…. on the threshold value… I want to set a threshold of 40 processes in this example.

Over 40 = Critical, and under = Healthy. Sounds good.

Create it – and lets see if we get any alerts:
Yep. Works perfectly:

A quick check of Health Explorer shows it is working as designed:

